Hi,
I recently tried out mriqc (v0.11.0) on a dataset and found a couple of T1w scans which were clear outliers on the q2 metric with values of 1.0 (group median 0.05). All of these scans had values within range on the q1 metric with values of close to or exactly 0.0. I then went ahead and inspected the histograms plotting the intensity distribution on the air mask in the corresponding verbose-reports plot and found that they did not display a distribution in any of the relevant scans. Here is an example for one outlier (other plots only differed in the scaling of the y-axis values):
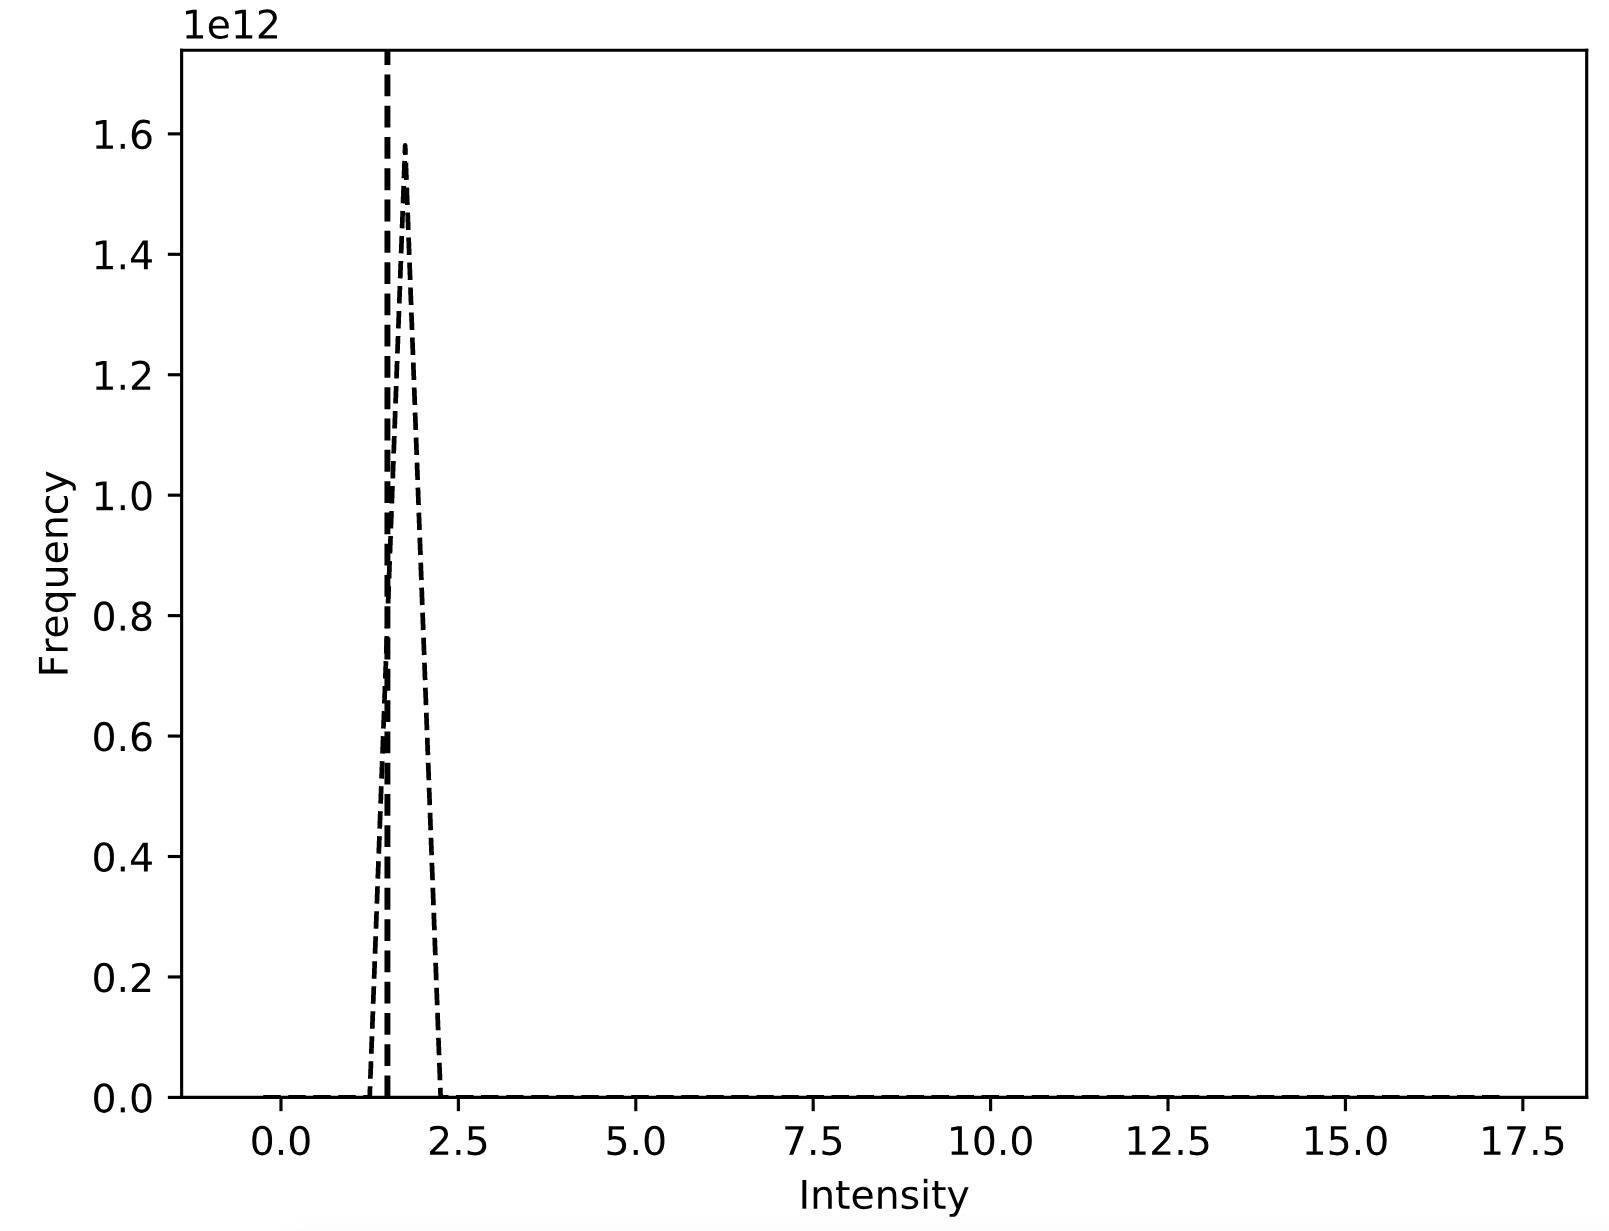
I was wondering whether these q2 values are plausible or whether there was a bug in the computation of either the q2 or the q1 metric (which q2 depends on) for these images (Maybe the artifactual intensities (relating to q1) were not properly identified and removed from the air mask before calculating q2 or there is some issue in the computation of q2 itself for these images?).
Please let me know if you have an idea what might be going on. Thanks for your help!