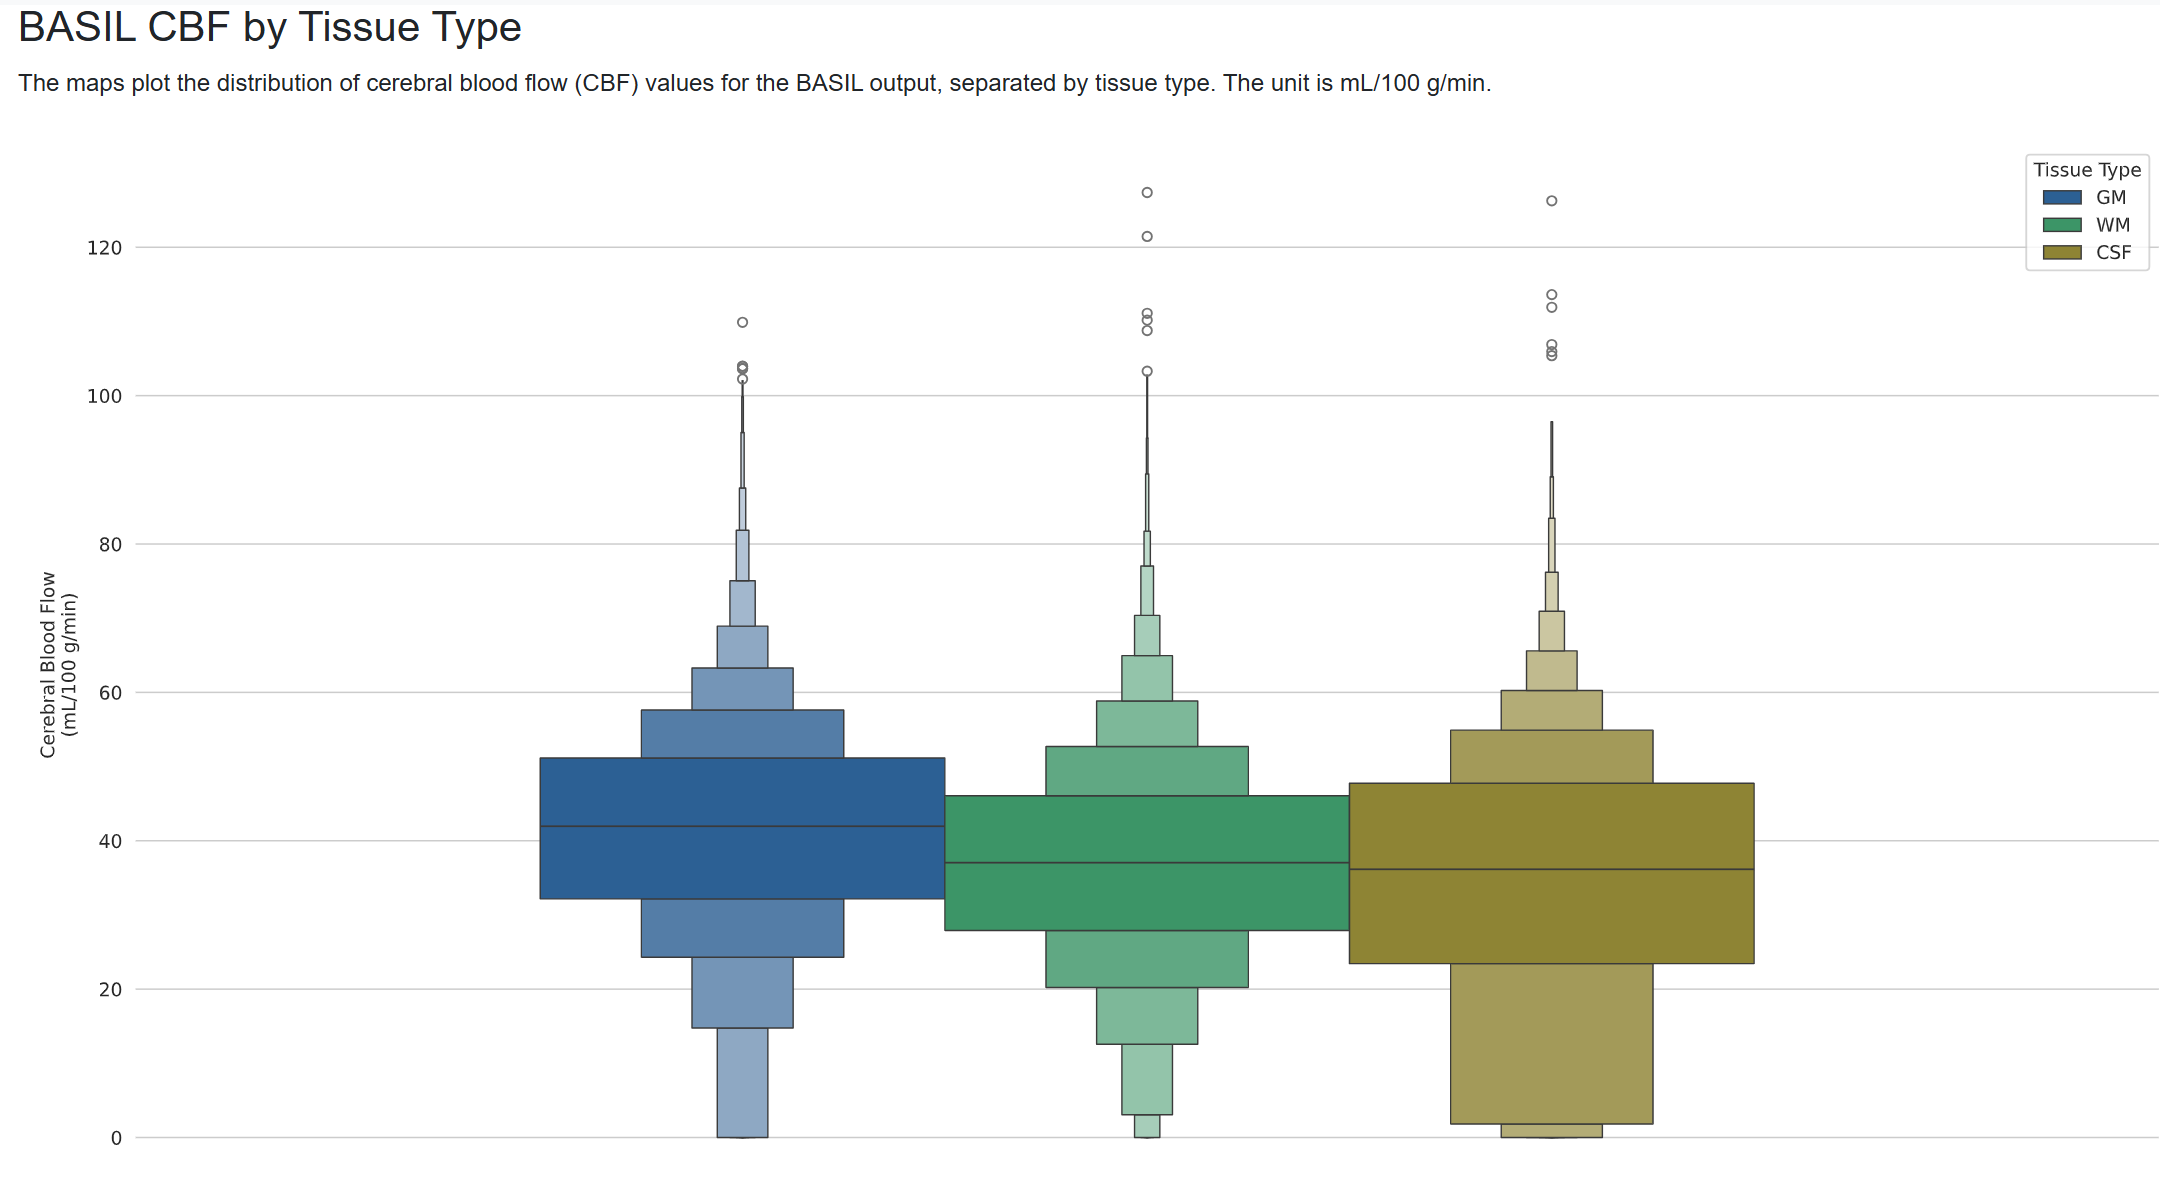
I’m running ASLPrep on multi-PLD pCASL UK Biobank data (using fMRIPrep derivatives for structural processing). In the “BASIL CBF by Tissue Type” panel of the visual report (the uncorrected BASIL output, sampled through the GM/WM/CSF tissue masks), I see little separation between the 3 tissue types.
Per documentation, I’d expect CSF to show ~0 CBF, but instead the distribution is very close to GM and WM (median ~37 vs. GM ~42, WM ~38). Can anybody advise what might be causing this?
Command used (and if a helper script was used, a link to the helper script or the command generated):
I don’t have access to any UK Biobank data, or data using the same sequence, but I simulated data with the UK Biobank ASL sequence (multi-delay PCASL, 2-shot 3D GRASE, 3.4 × 3.4 × 4.5 mm, one label/control pair per delay) and ran it through ASLPrep with --basil. My results aligned with the pattern you saw- CSF and WM CBF estimates higher than they should be.
The main issue appears to be partial volume effects. ASL voxels are typically large, and the tissue type plot categorizes each voxel into a single tissue type. A lot of the “CSF” voxels contain a fair amount of GM signal, pushing up the CBF estimates. I should probably spend some time figuring out a better way to present that information in the ASLPrep report.
Two other things appear to contribute to the problem: (1) the 3D GRASE readout blurs signal along the slice direction, spreading GM signal into neighboring WM and CSF voxels. (2) The sequence only includes one control-label pair for each PLD, which means the data are pretty noisy. When values should be 0 and there’s noise, the estimates should be distributed around zero (both positive and negative), but since BASIL restricts CBF to positive values, that means the noise can only push the CBF estimates up.
Given this am I correct in saying then this is a property of the data and not an issue of the pipeline? With this in mind I have a few follow up questions:
Can the output of the GM still be used?
We are interested in studying the pineal gland in particular - since this is a small structure and near a GM boundary, would this be possible? If so, is there specific caveats to keep in mind when doing this?
I’m sure ASLPrep could do better, but I do think this is primarily an unfortunate product of having large voxels rather than the pipeline.
Yes, I think the GM output (especially if you’re using the GM-partial volume corrected output, masked to only include the GM) can be used.
I know next to nothing about the pineal gland, but if it’s very small then it’s probably good to determine how many voxels it takes up. If your data doesn’t have the necessary spatial resolution to isolate it in at least a few voxels then it may not be a good target for your dataset.