Hi,
my goal is to create a surface plot onto which I project the contours of the significant activations of a thresholded z_map.
I am currently playing around with fitting parcellations (nilearn.regions.Parcellations) or extracting connected regions (nilearn.regions.connected_regions) and then mapping those on surfaces and plotting it via plot_surf and/or plot_surf_contours. However it does not really work stable, I get errors like Vertices in parcellation do not form region. for some z_maps, but not for others.
Here is an example how I tried to achieve this and which works for one z_map but not for another:
z_map = "path/to/z_map.nii'
thresholded_map, threshold = threshold_stats_img(z_map, alpha=alpha, height_control=height_control, cluster_threshold=cluster_threshold)

ward = Parcellations(method='ward', n_parcels=7,
                     standardize=False, smoothing_fwhm=None,
                     memory='nilearn_cache', memory_level=1,
                     verbose=0)
ward.fit(thresholded_map)
ward_labels_img = ward.labels_img_
texture = surface.vol_to_surf(ward_labels_img, fsaverage.pial_left)
texture[np.where(texture == 1.0)] = 0
texture[np.where(texture > 0)] = 1

fig = plotting.plot_surf(fsaverage.infl_left, hemi='left', threshold=1e-6,
                          bg_map=fsaverage.sulc_left)
plotting.plot_surf_contours(fsaverage.infl_left, texture, figure=fig, cmap='Greens')
What is the best way to extract the regions from the thresholded z_map and map it onto a surface so that plot_surf_contours accepts it as regions?
Thanks in advance!
Best, Marius
could you share z_map.nii?
and to avoid interpolating and averaging discrete label values, try using vol_to_surf(labels_img, n_samples=1, interpolation="nearest")
Ahoi hoi @maalaria,
it’s not quite the use case you’re describing/want, but Moritz Boos (couldn’t find the respective tag, sorry if I missed it) has a great and helpful post on surface contours here (sorry if you’re already aware of that). Maybe some portions of the code can be applied to your endeavor?
HTH, cheers, Peer
AFAICT the functionality implemented in that post was added to nilearn itself by Moritz in this PR: https://github.com/nilearn/nilearn/pull/2496 , and is what is being used here when calling plot_surf_contours
Hi @PeerHerholz, thanks for the link, I had already found this. However in his example he is using the predefined parcellation from the atlas. I think my main problem is how to properly extract the activated region so that I have a vertex representation (I hope that’s the correct) so that is excepted by plotting.plot_surf_contours().
I am trying now regions.connected_regions(), sees to work better then parcellations for my application. However I don’t need labels, is there a way to “flatten” the output of regions.connected_regions()?
Or is there a another method that I am not aware of?
Best, Marius
Hi Marius,
have you been able to find a solution?
I’ve just been running into the same problem while trying to add the contours of two ROIs in mask (*.nii.gz).
Kind regards,
Chris
Hi Chris, my solution for now is to use connectome workbench 
I did not really figure out why it sometimes worked and sometimes not using the nilearn functions. If you find a neat solution it would be great if you post it here!
Best, Marius
You might also try Surfice for this. The image below shows the results of script executed with the Scripting/Python/countour menu item
import gl
gl.resetdefaults()
gl.meshload('lh.pial')
gl.overlayload('boggle.lh.annot')
#make contour at border of atlas
gl.contour(0)
#reduce atlas salience:
gl.atlassaturationalpha(0.2, 0.5)
gl.overlayload('motor_4t95vol.nii.gz')
gl.overlayminmax(gl.overlaycount(),-2,-3)
#hide statistical map:
gl.overlayopacity(gl.overlaycount(),0)
#draw outline of statistical threshold
gl.contour(gl.overlaycount())
Hi everyone.
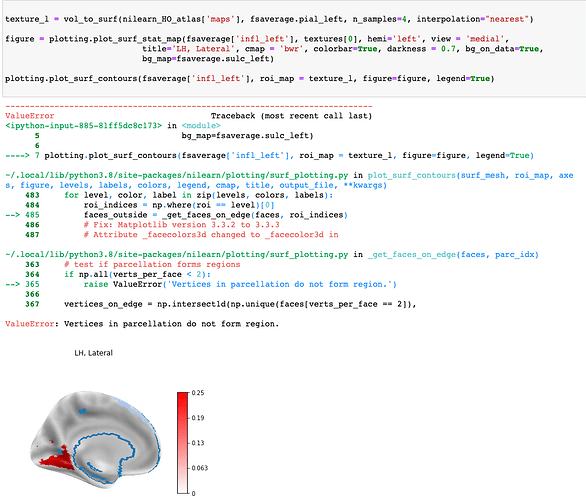
I’m trying to plot the contour of the Harvard-Oxford atlas onto a stat map.
Has the ValueError: Vertices in parcellation do not form region. issue been resolved yet? @jeromedockes I tried your solution with additional parameters in vol_to_surf, but I keep getting the same error. plot_surf_contours won’t accept a <nibabel.nifti1.Nifti1Image> either. Also, I haven’t found any examples of plot_surf_contours usage involving other atlas than Destrieux.


