So how should I write its code?
You can loop over subjects with something like this (my MATLAB memory is not great, syntax may not be exactly right):
for i=1:14
    ts_to_filt=sig.output_cell{i}
    filtered_ts=filtfilt(b,a,ts_to_filt)
    % store the output filtered ts however you'd like
end
1 Like
Hi,
Hope you are doing well.
I’ve solved the code you sent me before. Now I’ve got another error. “out of memory”
What should I do. I’ll send the whole code below.
%%
clc
clear
close all
%% Data Description

% 64 channels, 26 subject, 30800 timepoints, 256Hz(sampling rate), 120s
% 4 channels(Lateral Frontal: ch1=F3, ch2=F7, ch3=F4, ch4=F8)
% 14 Subject(Active) * 4 conditions(cd1=EC1, cd2=EC2, cd3=EO1, cd4=EO2)= 56 essays

%% Load data & Plot

% Taking one channel F3
% Taking first condition= EC1
fs=256; % Sampling frequency(Hz)

load P01EC1
sig1= P01EC1(:,1)';
figure
% subplot(4,1,1)
plot(sig1,'b','linewidth',0.5)
title('P01,EC1Active,Chennel F3 in Time domain')
xlabel('Time (s)')
ylabel('Voltage (mV)')
grid on
grid minor
N1 = length(sig1);
fx1 = fft(sig1);
fx1 = fx1(1:N1/2+1);
psd = (1/(fs*N1)) * abs(fx1).^2;
psd(2:end-1) = 2*psd(2:end-1);
freq = 0:fs/length(sig1):fs/2;

figure
plot(freq,10*log10(psd))
xlim([0 55])
grid on
grid minor
title('P01,EC1Active,Periodogram Using FFT')
xlabel('Frequency (Hz)')
ylabel('Power/Frequency (dB/Hz)')
%% Step: Denoising (50Hz)
% Step 1.1: Design stop filter
fl= 49.9;
fh= 50.1;
order= 3;
wn= [fl fh]/ (fs/2);
type= 'stop';
[b1,a1]= butter(order,wn,type);
%  Step 1.2: Apply notch (stop) filter
sig1= filtfilt(b1,a1,sig1);
%% Step: Fourier Transform
N1= length(sig1);
fx1= fft(sig1,N1);
figure
% subplot(4,1,2)
stem(abs(fx1),'b','linewidth',0.5,'marker','none')
title('P01,EC1Active,Chennel F3 in Frequency domain')
grid on
grid minor
%% Step: Select half of coeficients
fx1= fx1(1: round(N1/2));
figure
% subplot(4,1,3)
stem(abs(fx1),'b','linewidth',0.5,'marker','none')
title('P01,EC1Active,Chennel F3 in Frequency domain')
grid on
grid minor
%% Step 2.3 : Calculate Magnitude of coeficients
px1= abs(fx1);
%% Step 2.3 : Calculate Frequency Resolution
rf= linspace(0,fs/2,round(N1/2));
figure
% subplot(4,1,4)
stem(rf,px1,'b','linewidth',0.5,'marker','none')
xlim([0 55])
title('P01EC1,Active,Chennel F3 in Frequency domain')
grid on
grid minor
hold on
%% Step: Determine coeficients of rhythms
    % delta= 0.1-4 Hz,
    % theta= 4-8 Hz,
    % alpha= 8-12 Hz,
    % beta= 12-20 Hz,
    % lowgamma= 20-25 Hz,
    % gamma= 25-40 Hz
name={'Delta','Theta','Alpha','Beta','Lowgamma','Gamma'};
band= [0.1,4,8,12,20,25;
        4,8,12,20,25,40];
    for j=1:size(band,2) %first column:delta
        fl= band(1,j);
        fh= band(2,j);
        indx1= find(rf>=fl & rf<fh);
%         subplot(8,1,5)
        stem(rf(indx1),px1(indx1),'linewidth',0.5,'marker','none')
        title('Frequency Rhythms P01,EC1Active,Chennel F3 in Frequency domain')
        xpos=rf(indx1(1));
        ypos=max(px1(indx1));
        text(xpos,ypos,name{j},'fontsize',10)
%         drawnow
    end
    hold off
%%
sig1= P01EC1(:,1);
% figure
subplot(7,1,1)
plot(sig1,'b','linewidth',0.5)
title('P01,EC1Active,Chennel F3 in Time domain')
xlabel('Time (s)')
ylabel('Voltage (mV)')
grid on
grid minor
%% Design Filter for delta
% bandpass butterworth filter
fl= 1;
fh= 4;
order= 3;
wn= [fl fh]/(fs/2);
type= 'bandpass';
[b,a]= butter(order,wn,type);
% Apply designed filter
sig1_delta= filtfilt(b,a,sig1);
% Display result
% figure
subplot(7,1,2)
plot(sig1_delta,'b','linewidth',1)
title('Delta wave in Time domain')
grid on
grid minor
%% Design Filter for theta
% bandpass butterworth filter
fl= 4;
fh= 8;
order= 3;
wn= [fl fh]/(fs/2);
type= 'bandpass';
[b,a]= butter(order,wn,type);
% Apply designed filter
sig1_theta= filtfilt(b,a,sig1);
% Display result
% figure
subplot(7,1,3)
plot(sig1_theta,'b','linewidth',1)
title('Theta wave in Time domain')
grid on
grid minor
%% Design Filter for alpha
% bandpass butterworth filter
fl= 8;
fh= 12;
order= 3;
wn= [fl fh]/(fs/2);
type= 'bandpass';
[b,a]= butter(order,wn,type);
% Apply designed filter
sig1_alpha= filtfilt(b,a,sig1);
% Display result
% figure
subplot(7,1,4)
plot(sig1_alpha,'b','linewidth',1)
title('Alpha wave in Time domain')
grid on
grid minor
%% Design Filter for beta
% bandpass butterworth filter
fl= 12;
fh= 20;
order= 3;
wn= [fl fh]/(fs/2);
type= 'bandpass';
[b,a]= butter(order,wn,type);
% Apply designed filter
sig1_beta= filtfilt(b,a,sig1);
% Display result
figure
subplot(7,1,5)
plot(sig1_beta,'b','linewidth',1)
title('Beta wave in Time domain')
grid on
grid minor
%% Design Filter for lowgamma
% bandpass butterworth filter
fl= 20;
fh= 25;
order= 3;
wn= [fl fh]/(fs/2);
type= 'bandpass';
[b,a]= butter(order,wn,type);
% Apply designed filter
sig1_lowgamma= filtfilt(b,a,sig1);
% Display result
% figure
subplot(7,1,6)
plot(sig1_lowgamma,'b','linewidth',1)
title('Lowgamma wave in Time domain')
grid on
grid minor
%% Design Filter for gamma
% bandpass butterworth filter
fl= 25;
fh= 40;
order= 3;
wn= [fl fh]/(fs/2);
type= 'bandpass';
[b,a]= butter(order,wn,type);
% Apply designed filter
sig1_gamma= filtfilt(b,a,sig1);
% Display result
% figure
subplot(7,1,7)
plot(sig1_gamma,'b','linewidth',1)
title('Gamma wave in Time domain')
grid on
grid minor
%% Gathering all subjects in cd=1 EC1 Active
% Load EC1, Active
B=load('B.mat');
sig= B(:,:);
cd=1; % cd1= EC1 Active
% subs_al= zeros(size(sig));
% convert struct to double matrix
B = struct2cell(sig);
out = cat(2,B{:});
% B= cell2mat(struct2cell(sig));
%% Design Filter for alpha
% bandpass butterworth filter
fl= 8;
fh= 12;
order= 3;
wn= [fl fh]/(fs/2);
type= 'bandpass';
[b,a]= butter(order,wn,type);
for i=1:14
    ts_to_filt=sig.output_cell{i};
    subs_cd1_al=filtfilt(b,a,ts_to_filt);
end
%% Covariance
% Covariance gives the level of variability of random variables respect their means.
cov_cd1 = cov(subs_cd1_al(:,:,1)');
cov_cd1 = abs(cov_cd1 - diag(diag(cov_cd1)));

figure;
imagesc(cov_cd1);
axis square;
cb = colorbar;
cb.Label.String = 'Covariance level';
title('|Covariance|')
ylabel('nodes');
xlabel('nodes')
%% Pearson
% Linear correlaton between two random variables.
% In other words, how close the interdependency is near to a linear relation.
% It's also known to be the Covariance normalized as well as the $\tau=0$ of the Cross-Correlation function.

pea_cd1 = corrcoef(subs_cd1_al(:,:,1)');
pea_cd1 = abs(pea_cd1 - diag(diag(pea_cd1)));

figure;
imagesc(pea_cd1);
axis square;
colorbar;
title('|Pearson|')
Hello,
May you please send the full error traceback so I can see what command is promoting this error?
Best,
Steven
You can do clear $var1 $var2 to remove variables for memory. It might be good to clear some variables you don’t need anymore before reaching the memory intensive code.
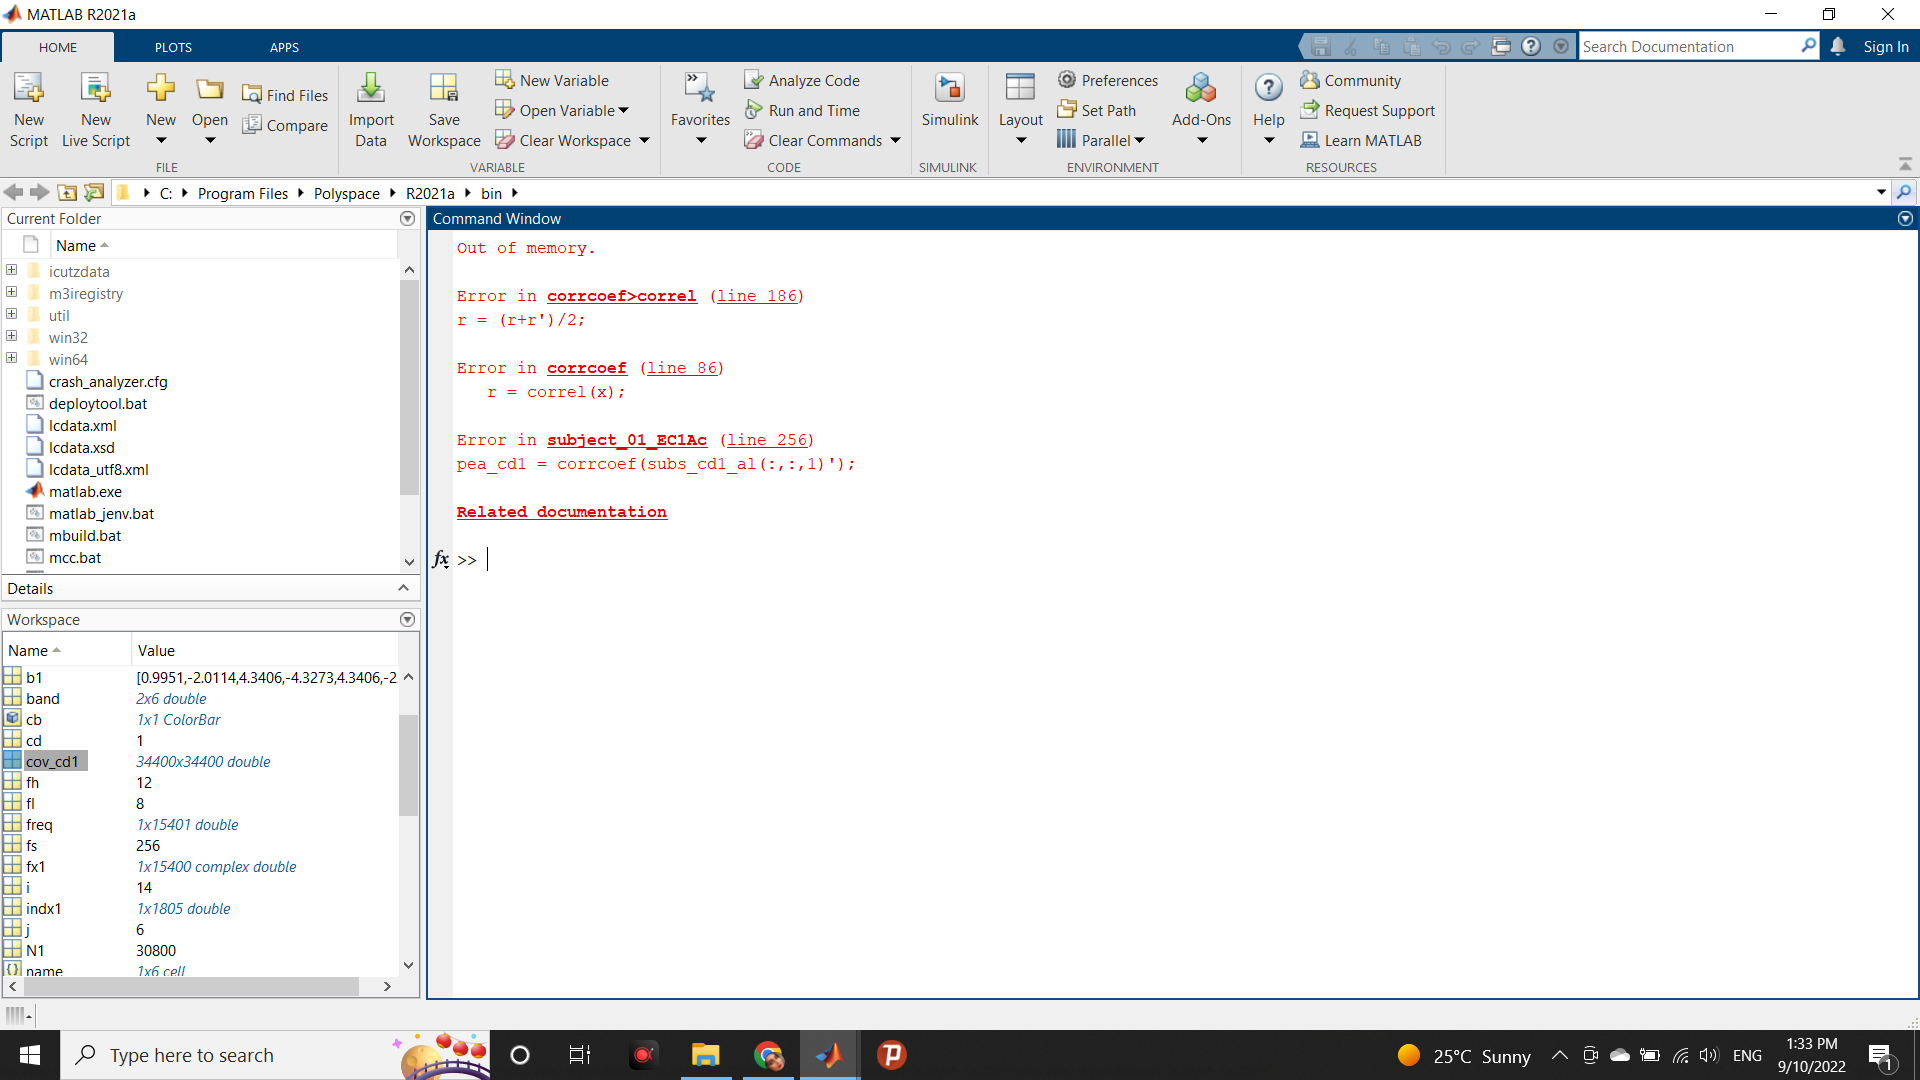
I still getting the error.
Out of memory.

Error in corrcoef>correl (line 186)
r = (r+r')/2;

Error in corrcoef (line 86)
   r = correl(x);

Error in subject_01_EC1Ac (line 255)
pea_cd1 = corrcoef(subs_cd1_al(:,:,1)');
Related documentation
What variables did you clear?
I cleared cov_cd1 and still got an error.
To better understand the error, I would need to know what you are trying to do with the command that causes the error, and the inputs to that command. Also how much RAM does your machine have?
I wanna calculate the covariance and Pearson correlation.
I tried each of them and execute them one by one and works! But when I run the covariance and person correlation, I’ve got an error.
RAM is 16GB
Okay, but what about the input to the command that is causing the error?
I’ve got this error. I did not get your exact meaning
Out of memory.
Error in corrcoef>correl (line 186)
r = (r+r’)/2;Error in corrcoef (line 86)
r = correl(x);Error in subject_01_EC1Ac (line 256)
pea_cd1 = corrcoef(subs_cd1_al(:,:,1)');Related documentation
In this case, the input is subs_cd1_al(:,:,1)’. What is it and what shape is it?
I have 14 subjects, each subject has 4 channels which are our columns. So I want to find covariance and correlation first between all channels of one subject and then find them for all subjects. The main problem is how can I do this first for one subject and then generalize to whole subjects.
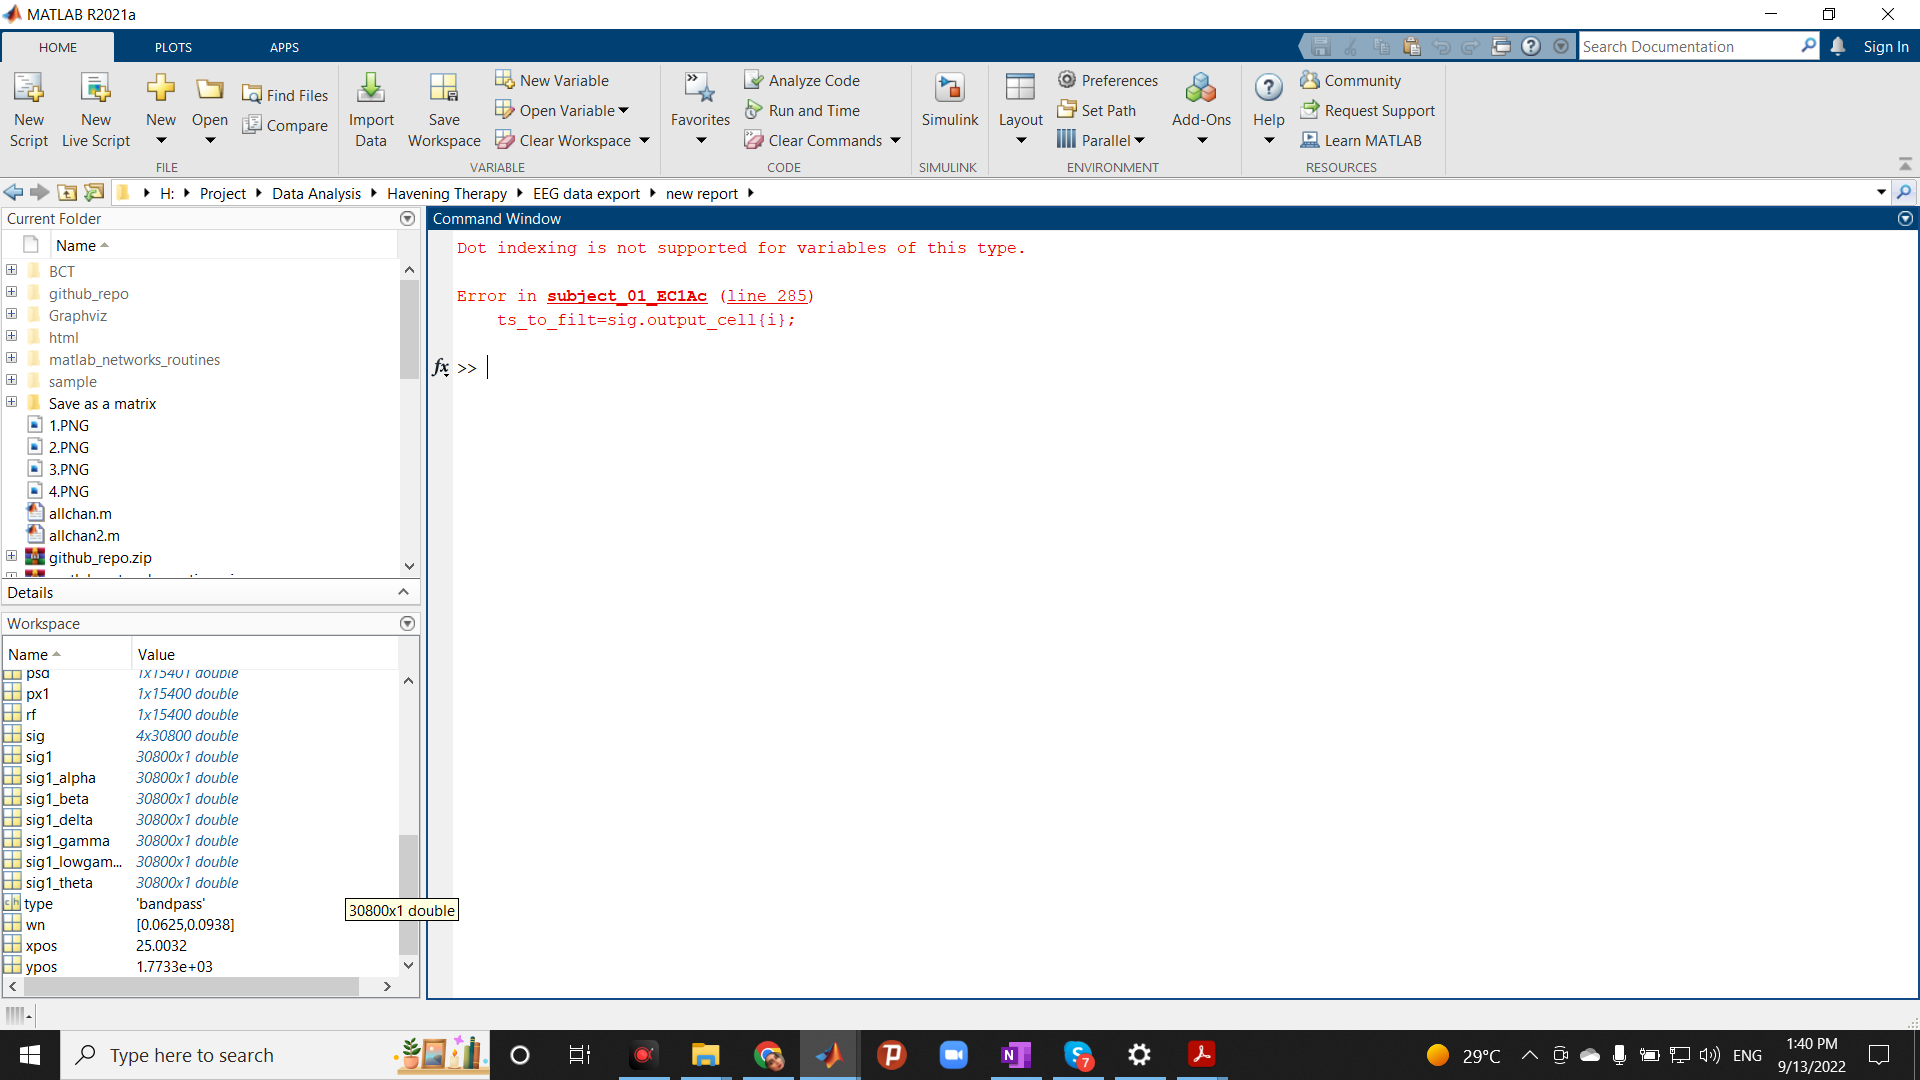
Now for one subject, I want to filter the alpha band for all channels. but in this for loop ts_to_filt=sig.output_cell{i}; I’ve got an error which is Dot indexing is not supported for variables of this type.
Design Filter for alpha
> fl= 8;
> fh= 12;
> order= 3;
> wn= [fl fh]/(fs/2);
> type= 'bandpass';
> [b,a]= butter(order,wn,type);
> for i=1:4
>     ts_to_filt=sig.output_cell{i};
>     subs_cd1_al=filtfilt(b,a,ts_to_filt);
> end
I am really thankful for your help. ![]()
![]()
Hi,
There is not enough info in that code block for me to help, as I cannot see how sig is defined and what kind of variable it is.
Best,
Steven
load P01EC1
sig= P01EC1(:,:)';
fl= 8;
fh= 12;
order= 3;
wn= [fl fh]/(fs/2);
type= 'bandpass';
[b,a]= butter(order,wn,type);
for i=1:4
    ts_to_filt=sig.output_cell{i};
    subs_cd1_al=filtfilt(b,a,ts_to_filt);
end
What kind of variable is sig? I believe only struct variables can be indexed with .
sig is 4x30800 double
So sig is just a matrix and has not field called output_cell. You can just find a signal by isolating a column of sig with sig(x,:)