I would like to conduct a SPM equivalent two-sample t-test analysis using nistats. My sample contains schizophrenic patients and healthy controls. I would like to compare their sMRI scans. In addition, I would like to use age and gender as covariates (see SPM-Manual, 10.4,1) and TIV as global value (see SPM-Manual, 10.6). How would you do this using nistats?
I read the OASIS example in the nistats documentation. I guess, that ‘comes close’ to the analysis I want to conduct (?), but I couldn’t find an example on how to include covariates and global values in the statistical analysis.
Hi,
Regarding covariates, the OASIS example indeed includes covariates: for instance, when you make inference on sex, age is a covariate. The philosophy is that everything is user-specified, and you need to check that the design matrix represents what you would like to have.
Regarding global values, I have to say, I don’t understand what they represent, as this is not explained in the SPM12 documentation. Is this used as a normalizaton, or simply a covariate ?
Best,
Bertrand
Ah, so if I get you right, that means all variables except the one you select as contrast variable will be treated as covariates?
Regarding global values, I have to say, I don’t understand what they represent, as this is not explained in the SPM12 documentation. Is this used as a normalizaton, or simply a covariate ?
That is a really good question, which I also don’t have an answer for. My naive assumption is, that TIV is also treated as covariate, but I am not sure.
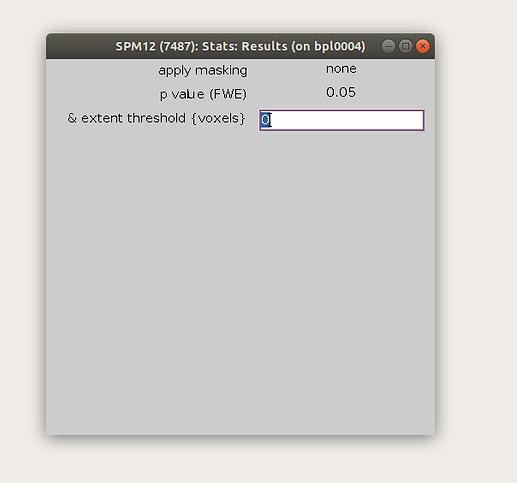
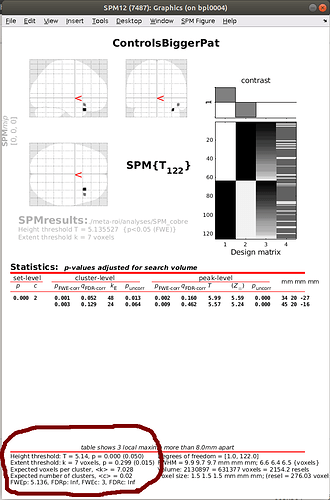
After calculating my t-test, I would like to stick to the SPM ‘standard’ p-value correction using nistasts, that is, choosing an FWE adjustment of 0.05 and to extent the threshold to an expected number of voxels, as shown in the SPM-output.
What would be the equivalent to that in nistats?
My idea was to use nistats.thresholding.map_threshold for that, setting height_control='bonferroni' and cluster_threshold=7, as recommended as expected number of voxels. Is this the right way to follow the SPM approach?
# threshold statistical image
z_map_thresholded, threshold = map_threshold(z_map,alpha=.05,height_control='bonferroni',cluster_threshold=7)

