Dear experts,
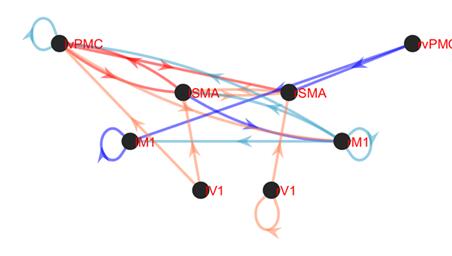
I would like to inquire if there are any good codes or tools for visualizing effective connectivity. It seems that tools like BrainNetViewer or Nilearn are generally only capable of plotting functional connectivity graphs, but the matrix for functional connectivity is symmetric, whereas the matrix for effective connectivity is not, so these tools may not be suitable for plotting. I used MATLAB code to draw directed graphs, which resulted in the following effect shown in the figure below. However, it was criticized for being rather crude and unattractive. Therefore, I am looking for better tools for visualizing effective connectivity, preferably ones that allow for the input of matrices to create the visualization.
Best,
Chuyue