Dear Neurostars Community,
I have a statmap exported from SPM, and I am trying to visualise it with nilearn using plot_stat_map or glass brain. Both plots show a weirdly inflated colorbar. Changing vmax changes the colored part of the colorbar, but the bug persists.
Interesting twists:
- this bug occurs both on my MacBook and on my mac at work.
- this bug occurs regardless of the python version I am using (3.7 and 3.10)
- this bug occurs regardless of which environment I am using (jupyter notebook or dataspell)
- I tried plotting via matplotlib, same problem!
- I sent my code and my .nii file to my colleague, and he does not have this bug. The colorbar appears normal.
Did anyone encounter such a problem? And, more importantly, is there a way to fix this?
Kind regards,
Alicja
Hi @Alicja.Olszewska 
Can you share the version of nilearn and of matplotlib you’re using for both your 3.7 and 3.10 environments ? And can you confirm that you’re colleague is also plotting using nilearn ? I assume as much from the fact that you sent him your code, but just to be explicit !
Elizabeth
Thank you for your answer Elizabeth @emdupre .
I am using nilearn version 0.9.0 and matplotlib v. 3.5.1 on both systems. Yes, my colleague is using the same exact code. His setup is nilearn v. 0.9 and matplotlib version 4.3.4. Here’s a snippet of two approaches we tried:
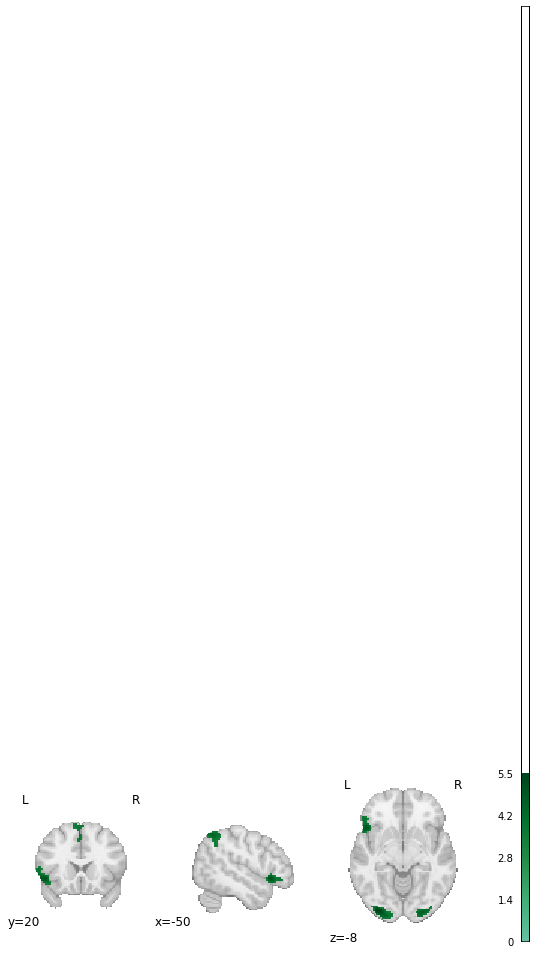
(1)
plotting.plot_stat_map(img, cut_coords=[20, -50, -8], colorbar = True, draw_cross = False, cmap = ‘cyan_copper’, vmax = 7)
(2)
import matplotlib.pyplot as plt
p = plt.figure(figsize=(24, 8))
plotting.plot_stat_map(img, cut_coords=[20, -50, -8], colorbar = True, draw_cross = False, cmap = ‘cyan_copper’, figure=p)
both have the same issue on my systems.
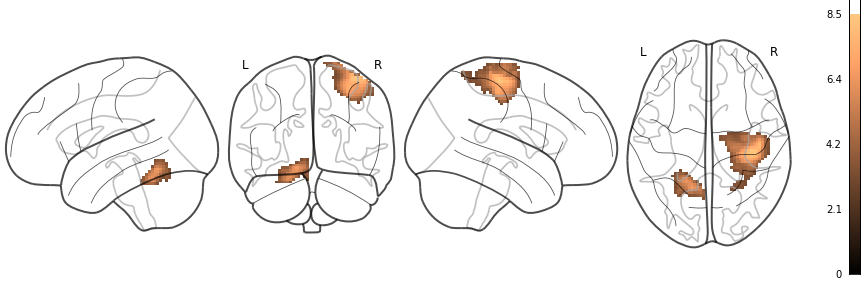
I tried exporting the images directly to files and the issue is somewhat better, but not solved completely, here’s an image of a different stat map on a glass brain
As you can see, the exported image has the bar cut off at the image border, but it’s still not perfect.
Any ideas how to fix that would be appreciated 
Thanks for confirming and sharing this additional information !
It seems like the immediate fix is to upgrade your matplotlib version to a more recent release. Could you please try that and let us know if it resolves the issue ?
Even if it does: 3.5.1 is a supported matplotlib release for Nilearn, so I wouldn’t expect this behavior. Once we confirm that it’s tied to this older MPL release, we can hopefully address it directly in the Nilearn codebase !
Thanks again,
Elizabeth
Dear Elizabeth @emdupre,
It seems that 3.5.1 is the latest release of matplotlib? Anyway, I downgraded to a version my colleague uses (3.4.3) and the colorbar behaves properly now, thanks for the solution!
Sorry, I looked too quickly and thought you had said that your colleague had a newer MPL version ! You’re correct that 3.5.1 is the newest release.
I’ll open an issue on the Nilearn github and crosslink this NeuroStars post so we can confirm that we’re supporting the newest MPL release. Thanks for reporting this !
Elizabeth
Here’s the GitHub issue, in case you’d like to chime-in there : https://github.com/nilearn/nilearn/issues/3183
Indeed it is a nilearn bug due to a change in matplotlib (see details in the issue linked by @emdupre ). In the meanwhile you can downgrade matplotlib or use nilearn.plot_stat_map(..., symmetric_cmap=True)
2 Likes