The HTML reports put together by MRIQC, FMRIPREP, and FSL (and I’m sure others) are great for facilitating QC of processing pipelines. The structure of these reports seems fairly standard though and it seems like the kind of functionality that’s screaming out for abstraction, especially as the BIDS-App ecosystem grows. I think it’d be pretty straightforward to put together a quick script with a Jinja template that would parse a JSON and create individual and group level HTML reports. Then any bids app that wanted slick looking HTML reports would just have to generate an appropriately structured JSON. I’m thinking that schema could be something like what Mindcontrol already uses:
Images lists the images to be displayed. Entry_type specifies the section of the report. Metrics correspond to statistics that can be plotted at the group or individual level. Subject_id, session_id are used as in the BIDS spec.
Report structure and options (like mosaics vs embedded viewer, colormaps, chart types) could be specified in a separate JSON, or as runtime parameters.
Has anyone done any work on creating a package for BIDS-App report generation? Would anyone else find it useful? What functionality would it need to have before you’d consider using it?
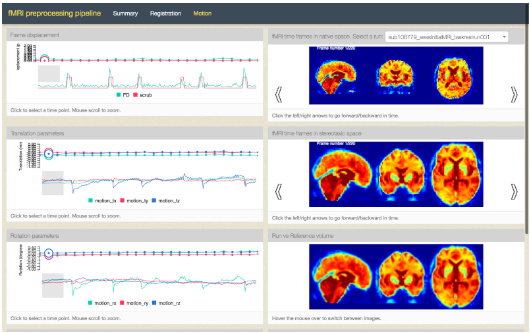
we are working on that right now. The idea is a report dashboard that runs in a local browser session and lets you see interactive reports on group, subject, run level statistics, and images. We build the inputs directly from the bids derivative folder as that gives us more freedom in how we want to organize especially visual representations but we definitely want to integrate views used in the fmriprep report.
Something like that:
Currently we are running this in a lab-internal beta to flush out bugs but our plan is to make a demo at the resting state conference in Montreal in September and integrate that with other efforts to make standardized, pipeline independent QC workflows. The dashboard would be a bids-app that works on the bids derivative standard. Currently, we are focused on a resting state fMRI QC workflow since that is the core of what our lab does but we’d like to explore options to extend the scope once everything works solidly.
Hi Seb,
That looks like a nice interface, I can’t wait to check it out. Is it just an HTML or does it require a server behind it? Is the BIDS-Derivative spec stable enough now that BIDS-App developers can start targetting it? I do think the flat HTML reports are important for usability and portability, as well as integrating smoothly into the OpenNeuro interface. In either case, I think it would be great for if these solutions could give app creators the flexibility to create QC workflows that make sense for their pipelines.
That looks like a nice interface, I can’t wait to check it out.
Thanks. This is work of @jarmoza@pbellec and me. Would be great to get your (and others) feedback. We are still tweaking some stuff but you’d be welcome to try our beta out on your data when that’s done. We’ll also be at the INCF hackathon to discuss this.
Is it just an HTML or does it require a server behind it?
It’s written in javascript and generates views dynamically from local files in a directory structure. It runs in a local browser session, there is no server behind it. You can put it on a thumb drive and give it to someone else to look at and it works just the same.
Is the BIDS-Derivative spec stable enough now that BIDS-App developers can start targetting it?
I don’t know as I’m not (yet) involved with that process. But as you suggested above, the standard could be represented as a .json that encodes where to look for certain files. In fact, that’s what we are doing internally. So any changes in the organization of the derivatives would be relatively easy to implement. However, we have some intermediate steps to go from the outputs of say fmriprep to what our dashboard reads in. For example we apply the T1-template transformation on the non-skullstripped T1 in native space because we like that better for coregistration QC. If that becomes part of the BIDS derivative standard we wouldn’t need to do that.
I do think the flat HTML reports are important for usability and portability
Agreed. Although we do find that linking some sections of the report (e.g. motion estimates and video of the raw data) or updating views interactively (rating and moving between subjects by hotkey) makes our QC pipeline easier and faster.
as well as integrating smoothly into the OpenNeuro interface
that would indeed be good but I don’t know what the requirements are for that. Could be a good hackathon discussion topic.
Just to speak to one minor point @Shotgunosine brought up: I don’t think the BIDS Derivatives spec is stable just yet. The extension proposal is available here and there are still quite a few open topics of discussion.
That being said, it’d be great to get your feedback there on what derivatives you’ve found most helpful working with your viewer !
Hi all!
This topic is 5y old but still hot in my opinion!
Are there any tools available for report generation? I use self-made stuff that are far less pretty than those from e.g. fmriprep or mriqc…
Thanks for your input!
Antonin
There’s actually been something happening over at nipreps since a while. Specifically, in the niworkflows project, which has a reports and visualization package. I haven’t used it myself and am not sure if it’s “ready to go” but might be worth a look.