I’m trying to plot an image including values bigger than 0. Values are corresponding to a ratio numbers, so it’s important to be able to separate values smaller than 1 (blue color) and bigger than 1 (red color) along with a white collor for 1. I also needed to log normalized values.
I’m currently using the following code to represent, but I need help to have a colorbar similar to what I explained like the colorbar requested in link . Thank you.
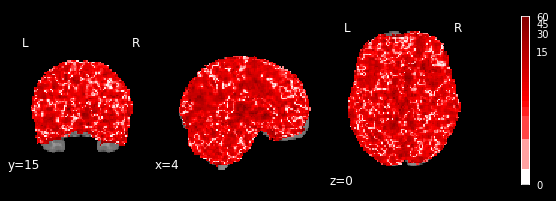
plotting.plot_stat_map(img_, vmax=60, black_bg=True, display_mode='ortho', colorbar=True,
                                    norm=matplotlib.colors.SymLogNorm(linthresh=1),
                                    cmap='seismic',cut_coords=[4,15,0], draw_cross=False)