Summary of what happened:
Hello folks,
I am working on a bunch of analysis on a new sequence and would like to compare sensitivity to detection on several measures.
So it would be very interesting to be able to concatenate images with additional data written on the images.
So far, I’ve managed to plot the data, but I would like to add the thresholds and color bar values beneath the images .
I would love to understand how can I script something to make images like such
I have found some new improvements by ptaylor, but I cannot find a reliable way to produce these images.
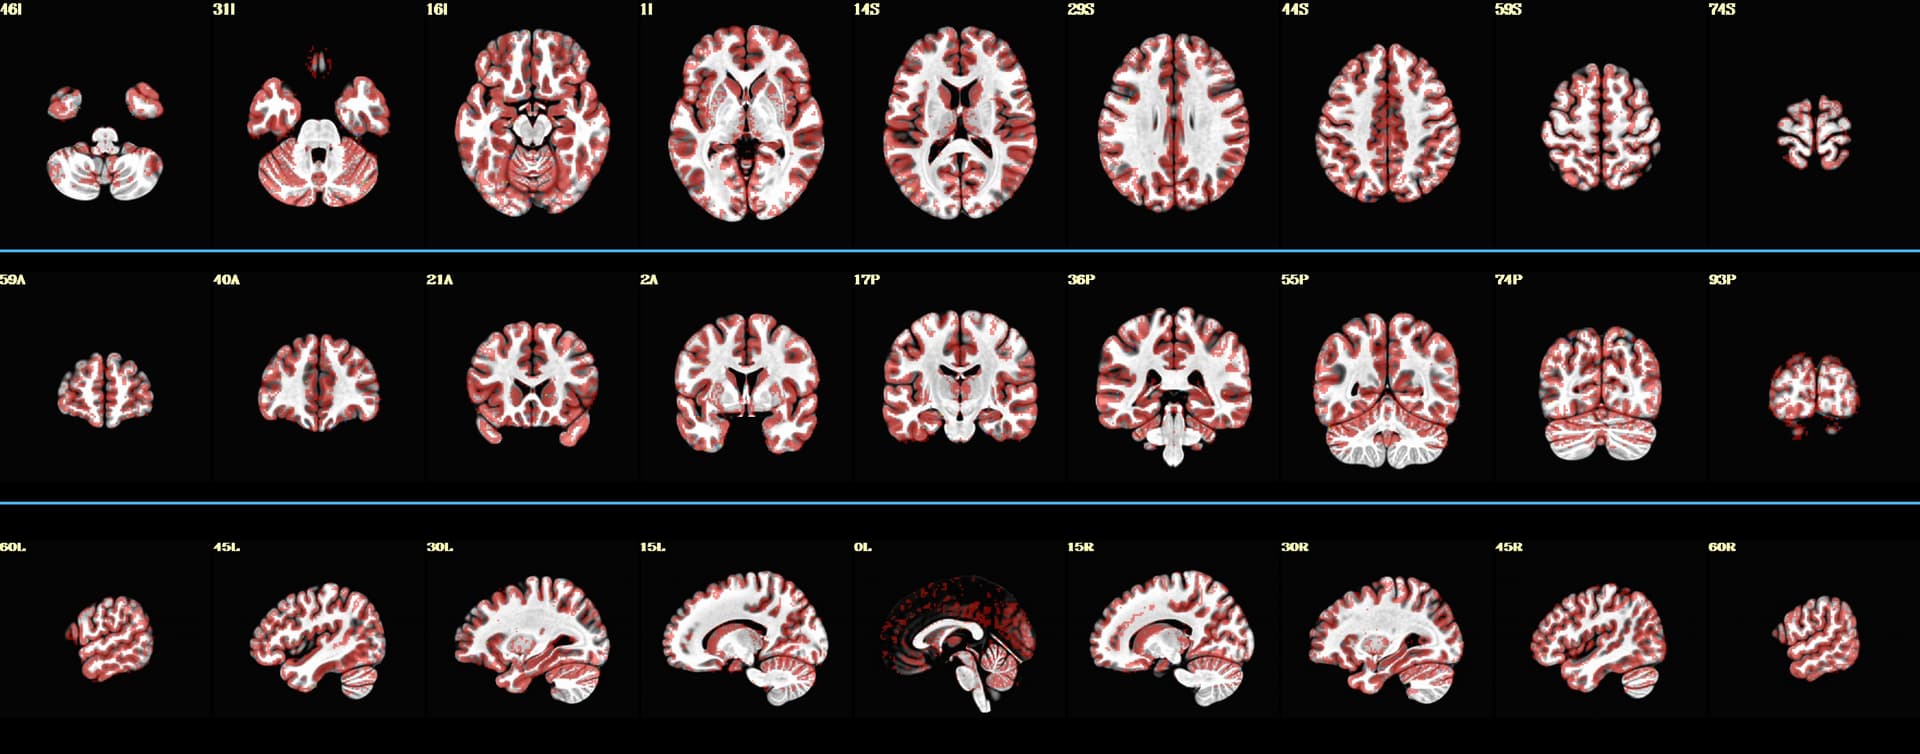
So far, code below can produce images like displayed below :
Can anybody help/guide me ?
Command used (and if a helper script was used, a link to the helper script or the command generated):
    @chauffeur_afni                                                 \
            -ulay ${background}                                     \
            -ulay_range "2%" "98%"                                  \
            -olay ${tempFolder}/meanInputDataSet+tlrc               \
            -func_range_perc_nz 1                                   \
            -set_subbricks 0 0 0                                    \
            -box_focus_slices ${tempFolder}/meanInputDataSet+tlrc   \
            -cbar "Reds_and_Blues_Inv"                              \
            -pbar_saveim       ${tempFolder}/color_bar              \
            -opacity 4                                              \
            -prefix  $tempFolder/tempPlots                          \
            -thr_olay 0                                             \
            -save_ftype JPEG                                        \
            -montx 9 -monty 1                                       \
            -montgap 3                                              \
            -set_xhairs OFF                                         \
            -pbar_posonly                                           \
            -label_mode 1 -label_size 3


colorbar_tool.py -in_cbar ${tempFolder}/color_bar.jpg \
            -in_json ${tempFolder}/color_bar.json \
            -prefix ${tempFolder}/test1.jpg

2dcat                                  \
        -gap 5                             \
        -gap_col 66 184 254                \
        -nx 1                              \
        -ny 4                              \
        -prefix ${output_prefix}           \
        $tempFolder/tempPlots*jpg ${tempFolder}/test1.jpg
Version:
I run Ubuntu 22.04.4 LTS
AFNI Version AFNI_25.2.16 ‘Gordian I’
And Python 3.10.12
I use tcsh scripts and am trying to create a .sh functions to plot the said images