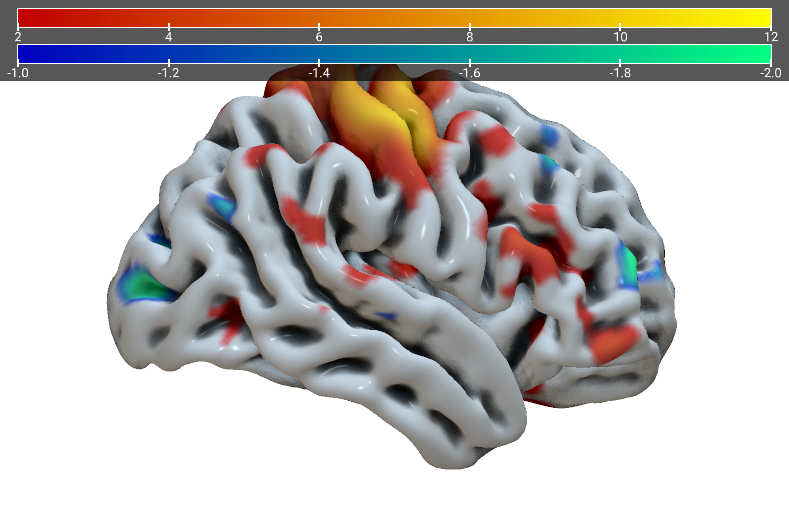
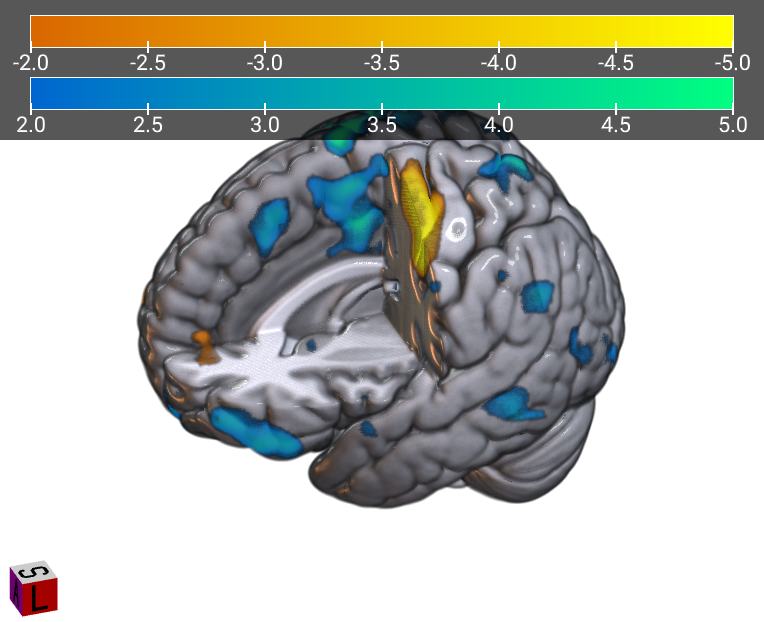
I’ve used XCP‑D output to run group‑level ReHo and ALFF analyses with the Gordon parcellation, and I’ve also computed FC contrasts between diagnostic groups. From these analyses I now have lists of significantly altered parcels and their Gordon network labels.
I’d like to overlay these results on publication‑quality brain maps either on cortical surfaces or MNI slices and color‑code regions (or edges) by their network. I failed with Nilearn
( i haven’t Matlab)
You might want to try MRIcroGL (for voxels) and Surfice (for meshes). Both are open source, free stand alone applications that include a Python interpreter to showcase features and automate reproducible images. Each has many example scripts as menu items in the Scripting/Templates menu that illustrate their capabilities and automate reproducible images.
The capabilities of both tools are part of ipyniivue which can be embedded into Jupyter notebooks. However, ipyniivue is still in development - so be aware that not all the capabilities are exposed to Python users yet.