Hello all
I am trying to understand Jackknife analysis. My CBMA steps are pretty similar to the ones used in NiMARE documentation. Having studies_df.csv and coords_df.csv files;
- I create the dataset
dbvia the following code:
dset_dict = {}
for i, row in studies_df.iterrows():
this_study_coords = coords_df[coords_df['study_id'] == row[0]]
contrast = {"coords": { "space": this_study_coords['space'].unique()[0],
                        "x": list(this_study_coords['x']),
                        "y": list(this_study_coords['y']),
                        "z": list(this_study_coords['z'])},
            "metadata":{"sample_sizes": [row[1]]}}

dset_dict[row[0]] = {"contrasts": {"1": contrast }}
with NamedTemporaryFile(mode='w', suffix=".json") as fp:
json.dump(dset_dict, fp)
fp.flush()
db = Dataset(fp.name)
Sanity check: Does my Step1 look okay for both ALE and MKDA analysis?
kernel_mkda = kernel.MKDAKernel(r = radius)meta_mkda_app = MKDADensity(kernel_transformer = kernel_mkda, null_method = 'approximate')mkda_uncorrected = meta_mkda_app.fit(db)corr_mkda = FWECorrector(method = "montecarlo", n_iters = 10000, n_cores = 8)mkda_corrected = corr_mkda.transform(mkda_uncorrected)jackknife = Jackknife(target_image = 'z_desc-mass_level-cluster_corr-FWE_method-montecarlo', voxel_thresh = None)- JK =
jackknife.transform(mkda_corrected.copy()) JK.tables['z_desc-mass_level-cluster_corr-FWE_method-montecarlo_diag-Jackknife_tab-counts_tail-positive'].
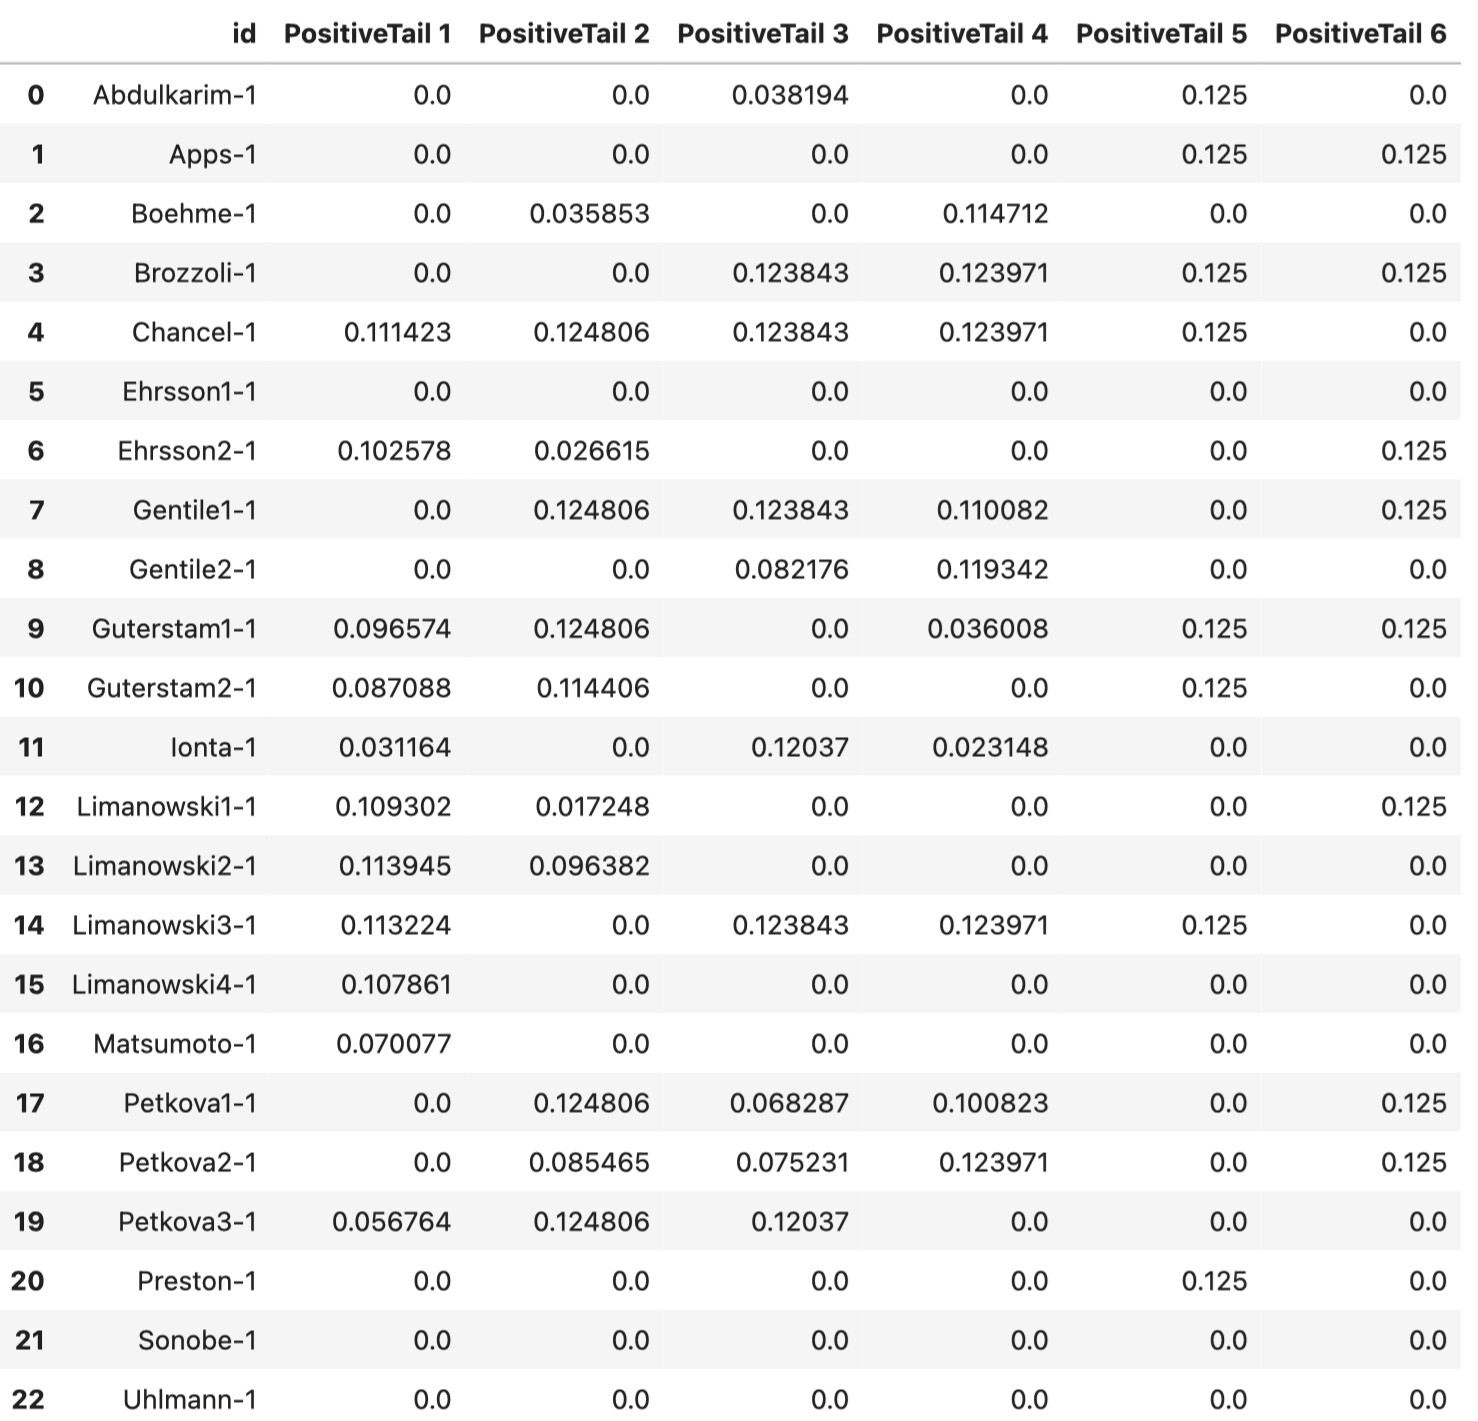
Question #1: What is the reason that the sum of all columns add up to 1? Is it because proportional summary statistics (z-score in this case) are averaged across all voxels in each cluster? Are they mass averaged? What does this look like? Can you explain it in a simple toy example?
Question #2: How to interpret the nonzero values in this data frame? My understanding is that the values have something to do with FWE corrected z-scores (or uncorrected z-scores?) if a given experiment wasn’t initially considered in the dataset, and hence provides a score for the heterogeneity of the dataset.
Say we are looking at the 1st row (Apps-1), we have 0.125 for both 5th and 6th clusters. What does having a 0.125 z-score say about the relationship between clusters 5 and 6? Or, in general, what does any number of clusters which have nonzero z-scores in the same row have in common?
Alternatively, by focusing on column 5 (PositiveTail5), how does the studies which have nonzero values (8 experiments with each having 0.125 as z-scores) in this column relate to each other?