I doubt it, it’s just that we commonly do not do this with nilearn (whereas it is common practice with SPM) so I was wondering where you got the idea from.
Because I joined a team that used SPM so far, but since I am comfortable with Python and not at all with MATLAB, I decided to switch to Nilearn. And I have learned it that way, I am not sure on how I could fit my GLM for all runs otherwise…
Removing outlier is a ‘dangerous’ territory as it is too easy to come up with reasons why you should remove certain subjects after you have seen the results which brings you into p hacking territory.
If you have got good evidence that the subject was not doing the task properly (missed most responses for example) you’d have a better ground for rejecting it that just saying “brain activation looks different”.
It’s the same as if you were trying to estimate any characteristic from a population (say the mean height of a certain population of humans): if you have only 3 individuals, your estimate of the mean may be way off compare to the ground truth just because of the sample you have.
The larger your sample is, the closer your estimate will be to the ground truth.
Super clear for the removing and outliers and the noise / amount of stim, thanks!
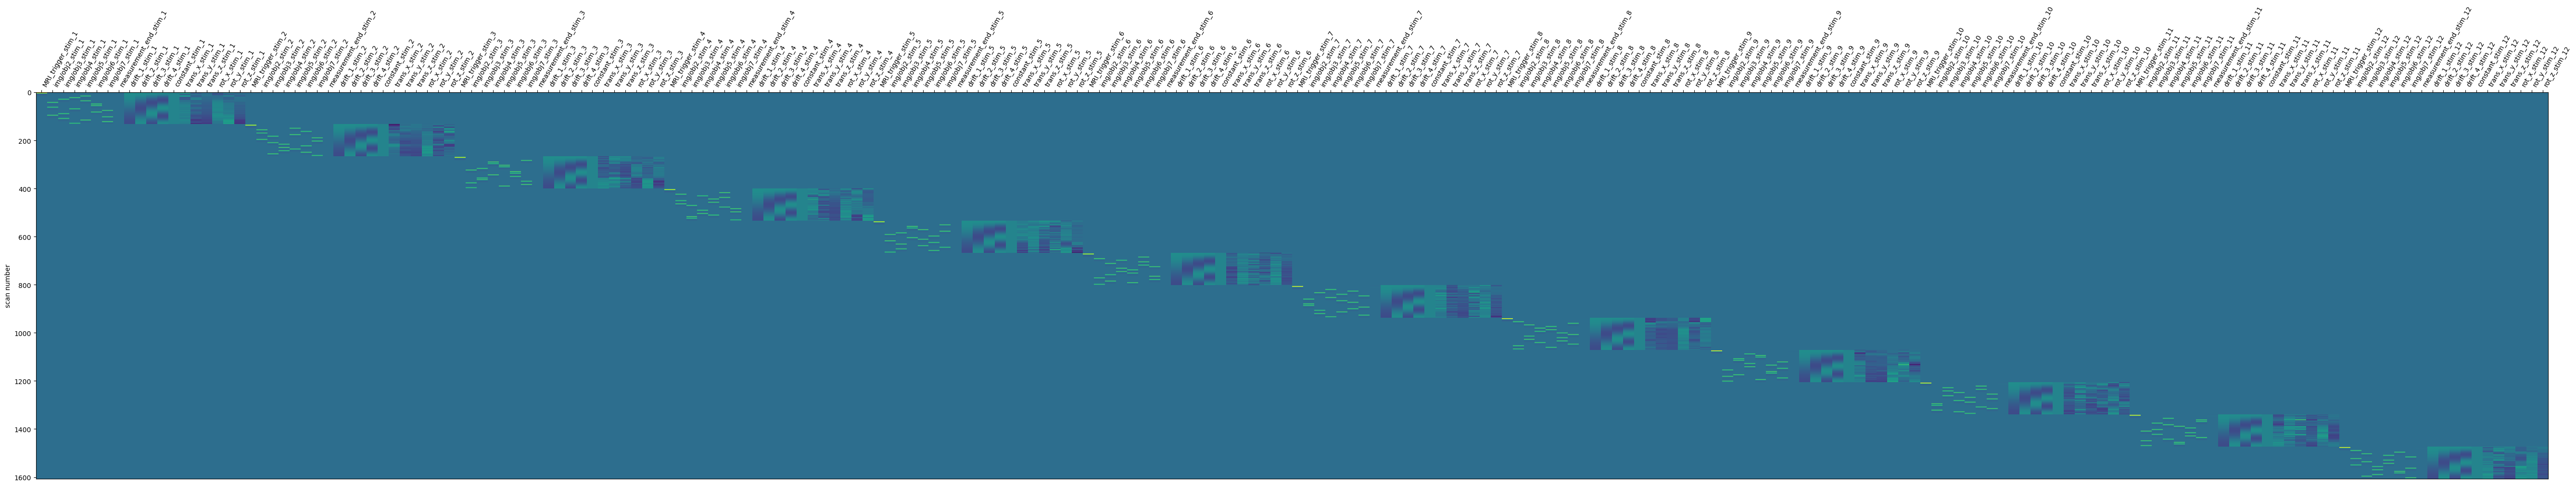
do you have the code you used to generate the contrast for the concatenated runs?
maybe we can start from there.
Regarding my scripts, here is what I do for 1st level GLM. I tried to provide the full script, but I am limited in terms of characters. I think you are mainly interested in the load_functional_images function
import os
import numpy as np
import pandas as pd
import time
from datetime import datetime
import warnings
import webbrowser
import joblib
import nibabel as nib
from nilearn import plotting
from nilearn.glm.first_level import FirstLevelModel
from nilearn.image import concat_imgs
from nilearn.glm.first_level import make_first_level_design_matrix
from nilearn.reporting import make_glm_report, get_clusters_table
from nilearn.plotting import plot_anat, plot_stat_map, plot_design_matrix, plot_contrast_matrix
from nilearn.glm import threshold_stats_img
from nilearn.interfaces.bids import save_glm_to_bids
#----------------------- Parameters -----------------------
# of-interest subfolder:
nilearn_folder = "nilearn_ge"
# Experimental design
TR = 1.5 # Repetition time
task_name = 'odor' # Depending on your design. Please see the structure of your BIDS files
subject_numbers = [
'03', '04'
] # List of subject numbers you want to analyse
run_numbers = range(1, 13) # List of the runs for each subjects you want to analyse (ex: run 1 -> 12 = range(1,13))
MRI_trigger_notzero = True # Set this to True if the MRI trigger timeset is not '0' in onset.
#### the contrast dictionnary for STIMULI can have the names you want
# then you attribute +1 or -1 values to the names of events you are interested in
rename_events_images = True # Set this to True if you want to rename the events names for images, so that we don't have to manually define each img/obj1_X.jpg that vary for each sub and run
# global
contrasts_dict_stim = {
"vision_olfaction": {"img/obj2":1, "img/obj3":1, "img/obj4":1,
"img/obj5":1, "img/obj6":1, "img/obj7":1,
"odor2_inhaled_onepiece":-1, "odor3_inhaled_onepiece":-1, "odor4_inhaled_onepiece":-1,
"odor5_inhaled_onepiece":-1, "odor6_inhaled_onepiece":-1, "odor7_inhaled_onepiece":-1},
}
# olfaction
contrasts_dict_stim_o = {
"o_global": {"odor2_inhaled_onepiece":1, "odor3_inhaled_onepiece":1, "odor4_inhaled_onepiece":1,
"odor5_inhaled_onepiece":1, "odor6_inhaled_onepiece":1, "odor7_inhaled_onepiece":1},
"o_food_human": {"odor2_inhaled_onepiece":1, "odor3_inhaled_onepiece":1, "odor4_inhaled_onepiece":1,
"odor5_inhaled_onepiece":-1, "odor6_inhaled_onepiece":-1, "odor7_inhaled_onepiece":-1},
}
#vision
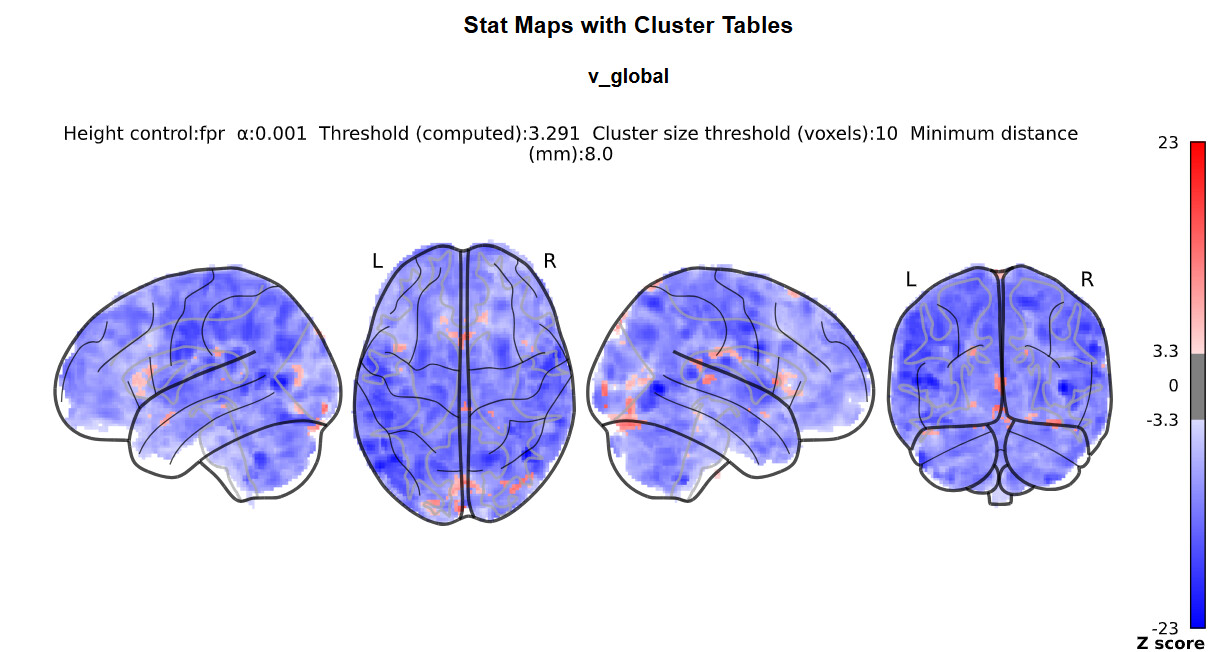
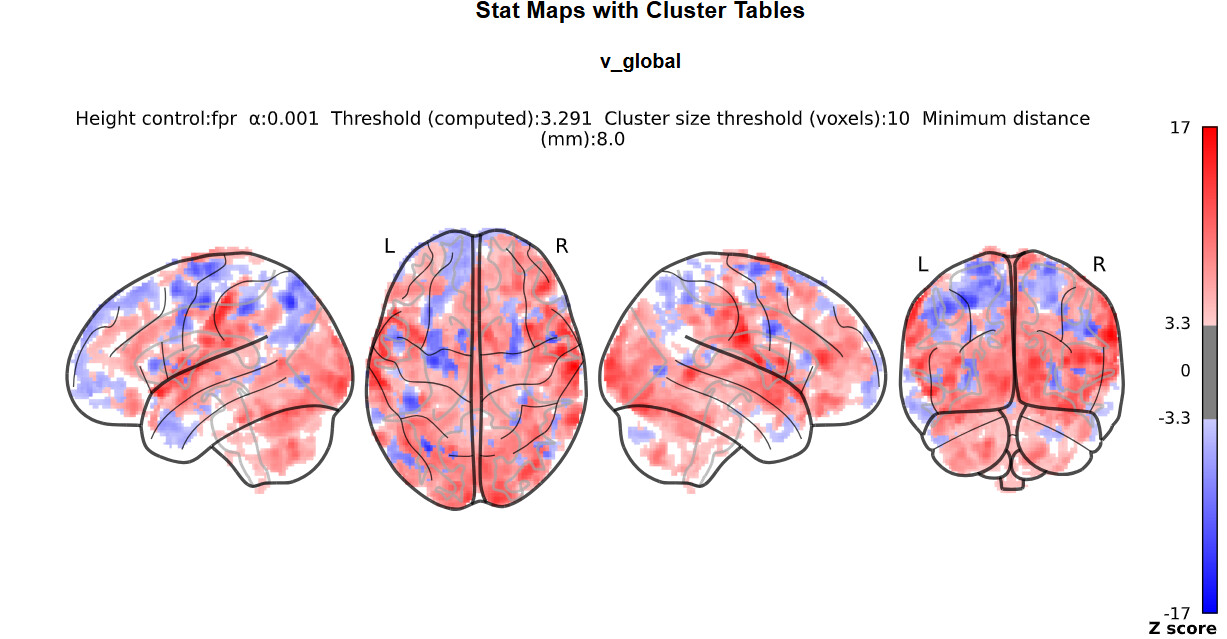
contrasts_dict_stim_v = {
"v_global": {"img/obj2":1, "img/obj3":1, "img/obj4":1,
"img/obj5":1, "img/obj6":1, "img/obj7":1},
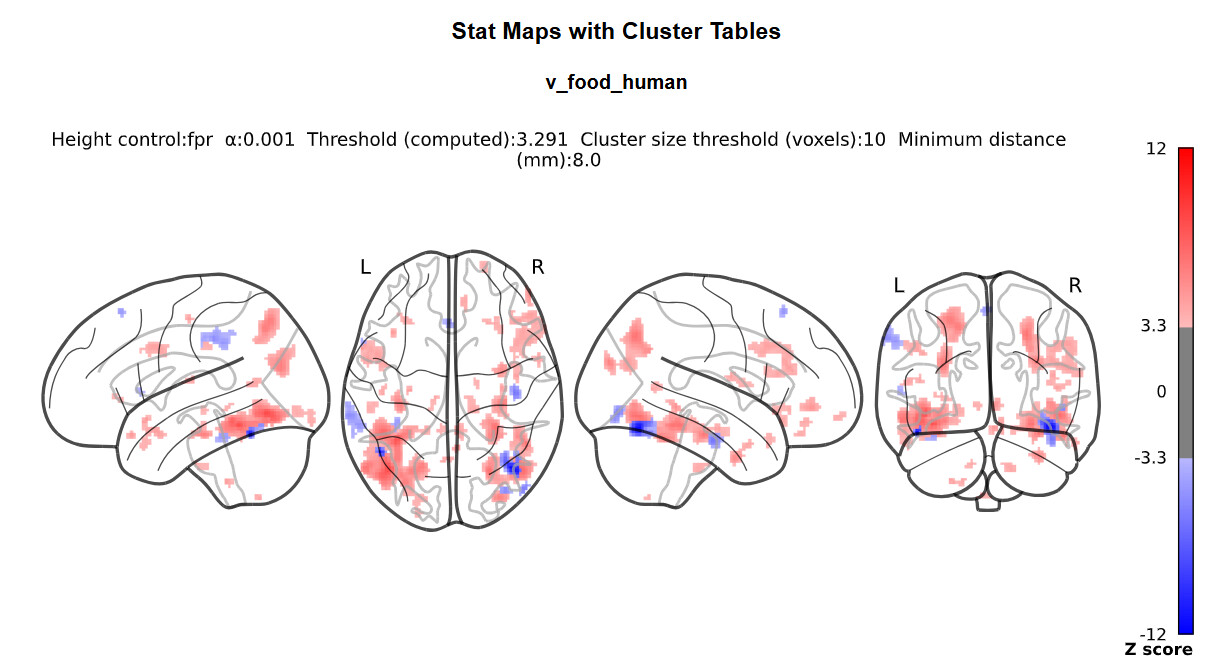
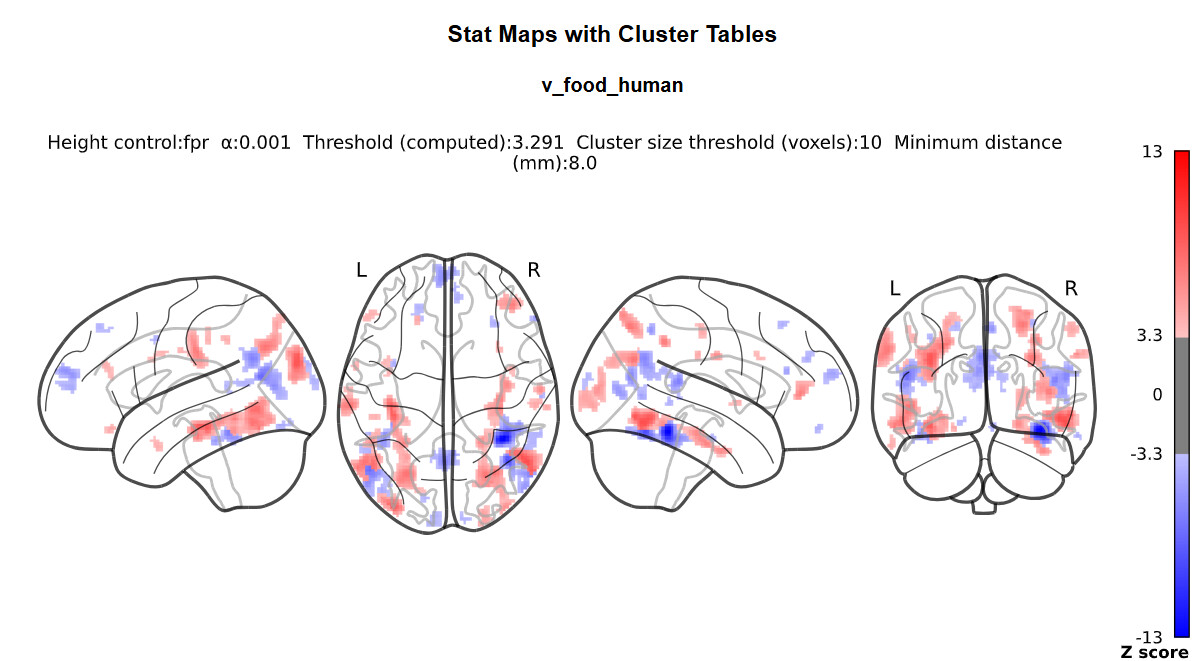
"v_food_human": {"img/obj2":1, "img/obj3":1, "img/obj4":1,
"img/obj5":-1, "img/obj6":-1, "img/obj7":-1},
}
# exlusion in events.tsv files for vision of olfaction
exclude_visual_trials = ['inhale', r'^odor']
exclude_olfact_trials = [r'^img', r'^odor.*_presented', r'^odor.*_inhaled_chunk']
exclude_redundant_trials = ['inhale', r'^odor.*_presented', r'^odor.*_inhaled_chunk']
#### the contrast dictionnary for TRIALS can have the names you want
# then you attribute +1 or -1 to the trials you are interested in
#it's beter to provide a contrasts_dict_trial, even if you're not interested in it
contrasts_dict_trial = {
"trial1_vs_trial2": {'trial1': 1, 'trial2': -1},
}
# confounds from fMRIprep. The names in the list_confounds are from any confounds_timeseries.tsv
include_confounds = True # Set this to True if you want to include confounds from fMRI prep
list_confounds = [
# 'white_matter',
'trans_x', 'trans_y', 'trans_z',
'rot_x', 'rot_y', 'rot_z',
# 'global_signal'
]
# Design matrix
drift_model = 'cosine'
high_pass = 0.01
hrf_model = 'spm'
# stimuli types to consider in the creation of the trial-wise matrix
trial_types = ['MRI_trigger',
'odor2_inhaled_onepiece', 'odor3_inhaled_onepiece', 'odor4_inhaled_onepiece',
'odor5_inhaled_onepiece', 'odor6_inhaled_onepiece', 'odor7_inhaled_onepiece',
'measurement_end']
# GLM and other parameters
noise_model = 'ar1'
standardize = False
smoothing_fwhm = 5
signal_scaling = False
minimize_memory = False
# z map
display_mode = 'lzry'
cut_coords = 3
black_bg = True
# report
bg_img='MNI152TEMPLATE'
height_control='fpr'
threshold = 3.09
alpha = 0.001 # false discovery rate fdr
cluster_threshold = 10 # number of voxels in a cluster to keep the cluster
two_sided=False
min_distance=8.0
plot_type='glass'
report_dims=(1600, 800)
# Other options
save_as_BIDS = True
save_design_matrix = True
save_glm_model = True
save_contrast_matrices = True
save_zmap = True
save_table = True
save_report = True
show_anatomical = False
show_plots = False
show_report = False
show_design_matrix = False
show_contrast_matrix = False
debug = False # set this to True if you want to see the debug messages
#----------------------- Parameters -----------------------
# saving path needed
subjfolder = datetime.today().strftime("%Y%m%d")
folders_1level = [
f"../results/{nilearn_folder}/{subjfolder}/glm_1level/stim",
f"../results/{nilearn_folder}/{subjfolder}/glm_1level/stim_o",
f"../results/{nilearn_folder}/{subjfolder}/glm_1level/stim_v",
f"../results/{nilearn_folder}/{subjfolder}/glm_1level/trial",
f"../results/{nilearn_folder}/{subjfolder}/BIDS_glm_1level/stim",
f"../results/{nilearn_folder}/{subjfolder}/BIDS_glm_1level/stim_o",
f"../results/{nilearn_folder}/{subjfolder}/BIDS_glm_1level/stim_v",
f"../results/{nilearn_folder}/{subjfolder}/BIDS_glm_1level/trial"
]
warnings.filterwarnings("ignore")
current_directory = os.getcwd()
(...)
def load_functional_images(subject_number):
"""
Load and concatenate functional images for the given subject, and calculate the number of scans (n_scans) per run.
Parameters:
- subject_number: ID of the subject.
Returns:
- concat_fmri_img: Concatenated functional images for the subject.
- n_scans_list: List of n_scans for each run.
"""
print(f"Loading functional images for sub-{subject_number}...")
functional_start_time = time.time()
functional_images = []
n_scans_list = []
for run_number in run_numbers:
run_str = f"{int(run_number):02}"
run_img_path = os.path.abspath(os.path.join(current_directory, "..", f"{nilearn_folder}", 'fmriprep',
f'sub-{subject_number}', 'func',
f'sub-{subject_number}_task-{task_name}_run-{run_str}_space-MNI152NLin2009cAsym_desc-preproc_bold.nii.gz'))
if debug:
print(f"--DEBUG Functional image path for run {run_str}: {run_img_path}")
# Load the image to calculate n_scans (number of TRs)
func_img = nib.load(run_img_path)
n_scans = func_img.shape[-1]
n_scans_list.append(n_scans)
functional_images.append(run_img_path)
concat_fmri_img = concat_imgs(functional_images)
print(f"Functional images for {len(run_numbers)} runs loaded and concatenated for sub-{subject_number} ({time.time() - functional_start_time:.2f} seconds). Shape = {concat_fmri_img.shape}")
return concat_fmri_img, n_scans_list
def load_and_prepare_confounds(subject_number, run_number, n_scans):
"""
Load and prepare confounds data for the specified subject and run, from fMRIprep.
Parameters:
- subject_number: ID of the subject
- run_number: the number of the run.
- n_scans: Calculated number of TRs for this run.
"""
if debug:
print(f"--DEBUG Loading confounds for sub-{subject_number}, run {run_number}...")
if not list_confounds or not isinstance(list_confounds, list):
print("ERROR: list_confounds is either empty or does not exist.")
return None
run_str = f"{int(run_number):02}"
path_confounds = os.path.abspath(os.path.join(current_directory, "..", f"{nilearn_folder}", 'fmriprep',
f'sub-{subject_number}', 'func',
f'sub-{subject_number}_task-{task_name}_run-{run_str}_desc-confounds_timeseries.tsv'))
if debug:
print(f"--DEBUG Confounds path for run {run_str}: {path_confounds}")
confounds = pd.read_table(path_confounds)
# Make sure that columns specified in list_confounds exist in the confounds DataFrame
confounds = confounds[list_confounds].replace(np.nan, 0)
confound_rows = confounds.shape[0]
if confound_rows > n_scans:
print(f"Run {run_number}: Too many ({confound_rows} rows), trimming at {n_scans} TRs.")
confounds = confounds.iloc[:n_scans, :]
elif confound_rows < n_scans:
print(f"Run {run_number}: Too few confounds ({confound_rows} rows), adding {n_scans - confound_rows} TRs.")
missing_rows = n_scans - confound_rows
zero_filler = pd.DataFrame(0, index=range(missing_rows), columns=confounds.columns)
confounds = pd.concat([confounds, zero_filler], axis=0)
return confounds
def create_stimulus_design_matrix(subject_number, run_numbers, include_confounds, design_type, n_scans_list):
"""
Create the design matrix based on stimulus for the subject, concatenated over all runs.
Arguments:
- n_scans_list
- subject_number: ID of the subject
- run_number: the number of the run.
- include_confounds: do you include confound in the analysis
- design_type: rather stim or tril
- n_scans_list: Calculated number of TRs for all the runs included.
"""
print(f"Creating {design_type.upper()} design matrix for sub-{subject_number}...")
stim_matrix_start_time = time.time()
design_matrices_stim = []
cumulative_scans_stim = 0
print(f" Importing and treating events for sub-{subject_number}...")
if include_confounds:
print(f" Importing confounds for sub-{subject_number}...")
for idx, run_number in enumerate(run_numbers):
path_events = os.path.abspath(os.path.join(current_directory, "..", f"{nilearn_folder}", 'bids',
f'sub-{subject_number}', 'func',
f'sub-{subject_number}_task-{task_name}_run-{run_number:02d}_events.tsv'))
if debug:
print(f"--DEBUG Events path for run {run_number}: {path_events}")
events = pd.read_table(path_events)
# Simplying the events names for images, so that we don't have to manually define each img/obj1_X.jpg that vary for each sub and run
if rename_events_images:
events.loc[events['trial_type'].str.startswith("img/"), 'trial_type'] = (
events.loc[events['trial_type'].str.startswith("img/"), 'trial_type']
.str.replace(r'(_.*$)', '', regex=True)
)
# Adjust onsets based on MRI trigger
trigger_onset = events[events['trial_type'] == 'MRI_trigger']['onset'].min()
if MRI_trigger_notzero and pd.notna(trigger_onset):
events['onset'] = events['onset'] - trigger_onset
events = events[events['onset'] >= 0]
# All events (minus redundants)
events_clean = events.copy()
for pattern in exclude_redundant_trials:
events_clean = events_clean[~events_clean['trial_type'].str.contains(pattern, regex=True)]
# Visual events
events_v = events.copy()
for pattern in exclude_visual_trials:
events_v = events_v[~events_v['trial_type'].str.contains(pattern, regex=True)]
# Olfact events
events_o = events.copy()
for pattern in exclude_olfact_trials:
events_o = events_o[~events_o['trial_type'].str.contains(pattern, regex=True)]
if debug:
print(f"--DEBUG events_v shape: {events_v.shape}, events_o shape: {events_o.shape}")
if design_type == 'stim':
events_to_use = events_clean
elif design_type == 'stim_o':
events_to_use = events_o
elif design_type == 'stim_v':
events_to_use = events_v
else:
raise ValueError(f"Unsupported design_type: {design_type}")
n_scans = n_scans_list[idx]
frame_times = np.arange(n_scans) * TR
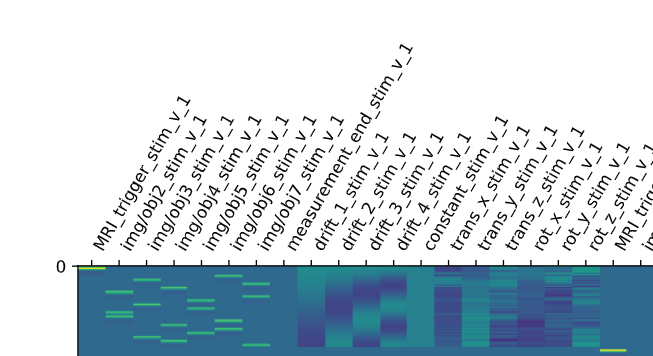
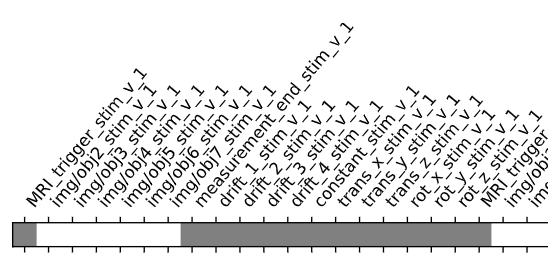
design_matrix_stim = make_first_level_design_matrix(
frame_times,
events_to_use,
drift_model=drift_model,
high_pass=high_pass,
hrf_model=hrf_model
)
if include_confounds:
confounds = load_and_prepare_confounds(subject_number, run_number, n_scans)
if confounds is None:
print(f"Skipping subject {subject_number} due to missing confounds.")
continue
confounds.index = design_matrix_stim.index
design_matrix_stim = pd.concat([design_matrix_stim, confounds], axis=1)
design_matrix_stim.columns = [f"{col}_{design_type}_{run_number}" for col in design_matrix_stim.columns]
design_matrix_stim.index += cumulative_scans_stim
design_matrices_stim.append(design_matrix_stim)
cumulative_scans_stim += n_scans
concatenated_design_matrix_stim = pd.concat(design_matrices_stim, axis=0).fillna(0)
concatenated_design_matrix_stim.reset_index(drop=True, inplace=True)
print(f"{design_type.upper()} design matrix concatenating {len(run_numbers)} runs created for sub-{subject_number} ({time.time() - stim_matrix_start_time:.2f} seconds). Shape = {concatenated_design_matrix_stim.shape}")
# showing & saving
if show_design_matrix:
plot_design_matrix(concatenated_design_matrix_stim)
if save_design_matrix:
design_matrix_stim_filename = os.path.abspath(os.path.join(current_directory, "..", 'results', nilearn_folder, subjfolder,
'glm_1level', design_type, f'sub-{subject_number}_design-matrix_{design_type}.csv'))
concatenated_design_matrix_stim.to_csv(design_matrix_stim_filename, index=False)
print(f"{design_type.upper()} design matrix saved to: {design_matrix_stim_filename}")
return concatenated_design_matrix_stim
(...)
def fit_glm(subject_number, design_matrix, design_type, concat_fmri_img):
"""
Fit a GLM model for the subject using the provided design matrix.
Parameters:
- subject_number: ID of the subject.
- design_matrix: Design matrix for fitting the GLM (can be 'stim' or 'trial').
- design_type: Type of design matrix ('stim' or 'trial').
- concat_fmri_img: the 4D MRI images concatenated over all runs for the subject
"""
print(f"Fitting {design_type.upper()} GLM for sub-{subject_number}...")
glm_start_time = time.time()
# Fit the GLM
glm_model = FirstLevelModel(
t_r=TR,
noise_model=noise_model,
standardize=standardize,
smoothing_fwhm=smoothing_fwhm,
hrf_model=hrf_model,
drift_model=drift_model,
high_pass=high_pass,
signal_scaling=signal_scaling,
minimize_memory=minimize_memory,
subject_label=f"{subject_number}"
)
glm_model.fit(concat_fmri_img, design_matrices=design_matrix)
print(f"{design_type.upper()} GLM fitted for sub-{subject_number} ({time.time() - glm_start_time:.2f} seconds)")
# Save the GLM model
if save_glm_model:
glm_filename = os.path.abspath(os.path.join(current_directory, "..", 'results', nilearn_folder, subjfolder,
'glm_1level', design_type, f'sub-{subject_number}_glm-model_{design_type}.pkl'))
joblib.dump(glm_model, glm_filename)
print(f"{design_type.upper()} GLM model saved to: {glm_filename}")
return glm_model
def create_contrasts(design_matrix, design_type, subject_number):
"""
Create contrasts for the given design matrix.
Parameters:
- design_matrix: Design matrix for fitting the GLM (can be 'stim' or 'trial').
- design_type: Type of design matrix ('stim' or 'trial').
- concat_fmri_img: the 4D MRI images concatenated over all runs for the subject
Returns:
- contrasts_list: Dictionary of contrasts for the specified design type.
"""
print(f"Creating {design_type.upper()} contrast matrices for sub-{subject_number}...")
contrast_start_time = time.time()
# Map each design_type to its corresponding contrast dictionary
contrast_dicts = {
"stim": contrasts_dict_stim, # fallback if "stim" aliases "stim_o"
"stim_o": contrasts_dict_stim_o,
"stim_v": contrasts_dict_stim_v,
"trial": contrasts_dict_trial,
}
# Get the appropriate contrast dictionary for this design_type
contrast_dict = contrast_dicts.get(design_type)
# Initialize contrasts to zero
contrasts_list = {
name: np.zeros(design_matrix.shape[1]) for name in contrast_dict.keys()
}
# Fill contrast vectors
for contrast_name, terms in contrast_dict.items():
for term, weight in terms.items():
for i, col in enumerate(design_matrix.columns):
if design_type == "trial":
if col.startswith(term + "_"):
contrasts_list[contrast_name][i] = weight
else:
if term in col:
contrasts_list[contrast_name][i] = weight
print(f"{design_type.upper()} contrast matrices created for sub-{subject_number} ({time.time() - contrast_start_time:.2f} seconds).")
for contrast_name, contrast_weights in contrasts_list.items():
print(f"Shape of {design_type.upper()} '{contrast_name}' contrast matrix for sub-{subject_number}: {contrast_weights.shape}")
# showing & saving
if show_contrast_matrix:
for contrast_name, contrast_weights in contrasts_list.items():
plot_contrast_matrix(contrast_weights, design_matrix=design_matrix)
if save_contrast_matrices:
contrasts_filename = os.path.abspath(os.path.join(current_directory, "..", 'results', nilearn_folder, subjfolder, 'glm_1level', design_type,
f'sub-{subject_number}_contrasts_{design_type}.npy'))
np.save(contrasts_filename, contrasts_list)
print(f"{design_type.upper()} contrast matrices saved to: {contrasts_filename}")
return contrasts_list
def generate_report(glm_model, contrasts_list, subject_number, design_type):
"""
Generate reports for each contrast based on the GLM model and contrasts.
Parameters:
- glm_model: Fitted GLM model for the subject.
- contrasts_list: Dictionary of contrasts for the specified design type.
- subject_number: ID of the subject.
- design_type: Type of design ('stim' or 'trial').
"""
print(f"Generating {design_type.upper()} report for sub-{subject_number}...")
for contrast_name, contrast_weights in contrasts_list.items():
report_start_time = time.time()
# Compute effect size and z-score maps
eff_map = glm_model.compute_contrast(contrast_weights, output_type='effect_size')
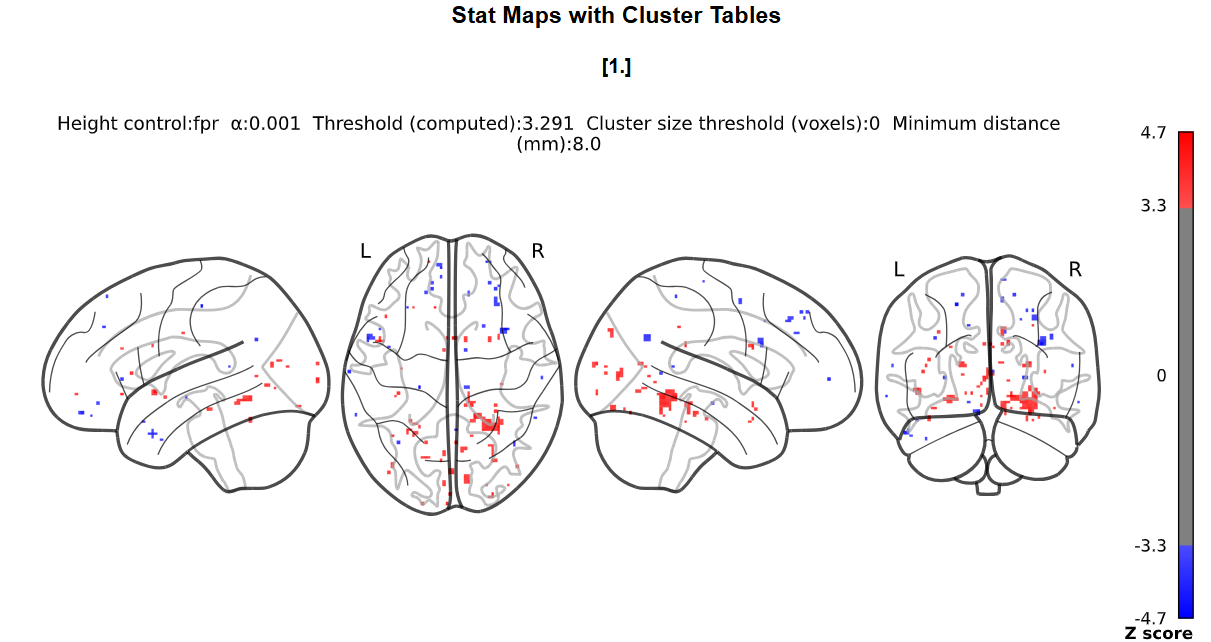
z_map = glm_model.compute_contrast(contrast_weights, output_type='z_score')
# Generate voxel table
table = get_clusters_table(
z_map,
stat_threshold=threshold,
cluster_threshold=cluster_threshold
)
# Create GLM report
report = make_glm_report(
model=glm_model,
contrasts={contrast_name: contrast_weights},
title=f"GLM 1lvl {design_type} - Report for {contrast_name} - Subject {subject_number}",
bg_img=bg_img,
threshold=threshold,
alpha=alpha,
cluster_threshold=cluster_threshold,
height_control=height_control,
two_sided=two_sided,
min_distance=min_distance,
plot_type=plot_type,
cut_coords=cut_coords,
display_mode=display_mode,
report_dims=report_dims
)
print(f"{design_type.upper()} stat map + voxel table + report created for {contrast_name} contrast for sub-{subject_number} ({time.time() - report_start_time:.2f} seconds)")
# saving & showing
if save_table:
table_filename = os.path.abspath(os.path.join(current_directory,"..", 'results', nilearn_folder, subjfolder, 'glm_1level', design_type,
f'sub-{subject_number}_voxel-table_cont-{contrast_name}_{design_type}.csv'))
table.to_csv(table_filename, index=False)
print(f"{design_type.upper()} voxel table for {contrast_name} contrast for sub-{subject_number} saved to: {table_filename}")
if save_zmap:
z_map_filename = os.path.abspath(os.path.join(current_directory, "..", 'results', nilearn_folder, subjfolder, 'glm_1level', design_type,
f'sub-{subject_number}_z-map_cont-{contrast_name}_{design_type}.nii.gz'))
nib.save(z_map, z_map_filename)
print(f"{design_type.upper()} z-map for {contrast_name} contrast for sub-{subject_number} saved to: {z_map_filename}")
if save_report:
report_filename = os.path.abspath(os.path.join(current_directory,"..", 'results', nilearn_folder, subjfolder, 'glm_1level', design_type,
f'sub-{subject_number}_report_cont-{contrast_name}_{design_type}.html'))
report.save_as_html(report_filename)
print(f"{design_type.upper()} report for {contrast_name} contrast for sub-{subject_number} saved to: {report_filename}")
if show_report:
webbrowser.open(report_filename)
return z_map
def save_results_as_bids(glm_model, contrasts_list, subject_number, design_type):
"""
Save GLM results in BIDS format for the specified design type (stim or trial).
Parameters:
- glm_model: Fitted GLM model for the subject.
- contrasts_list: Dictionary of contrasts for the specified design type.
- subject_number: ID of the subject.
- design_type: Type of design ('stim' or 'trial').
"""
print(f"Saving {design_type.upper()} GLM results in BIDS format for sub-{subject_number}...")
out_dir = os.path.abspath(os.path.join(current_directory, "..", 'results', nilearn_folder, subjfolder, 'BIDS_glm_1level', design_type))
contrast_types = ['z_score'] * len(contrasts_list) # Keep z-score as contrast type
if save_as_BIDS:
save_glm_to_bids(
model=glm_model,
contrasts=contrasts_list,
contrast_types=contrast_types,
out_dir=out_dir,
prefix=f'sub-{subject_number}'
)
print(f"{design_type.upper()} GLM results saved in BIDS format to: {out_dir}")
def main():
overall_start_time = time.time()
# First check
if not general_conditions(subject_numbers, run_numbers):
return
create_folders(current_directory, folders_1level)
print(f'\nNumber of subjects = {len(subject_numbers)}')
print(f'Number of runs = {len(run_numbers)}')
print(f'Number of contrasts - stimuli = {len(contrasts_dict_stim)}')
print(f'Number of contrasts - stimuli_o = {len(contrasts_dict_stim_o)}')
print(f'Number of contrasts - stimuli_v = {len(contrasts_dict_stim_v)}')
print(f'Number of contrasts - trials = {len(contrasts_dict_trial)}\n')
for subject_number in subject_numbers:
subject_start_time = time.time()
print("-------------------------------------")
print(f'\nStart - subject {subject_number} at {time.ctime(subject_start_time)}\n')
# Second check
conditions = verify_conditions(subject_number, contrasts_dict_stim, contrasts_dict_stim_o,contrasts_dict_stim_v, contrasts_dict_trial, current_directory)
if not conditions["stim"] and not conditions["stim_o"] and not conditions["stim_v"] and not conditions["stim_v"] and not conditions["trial"]:
print(f"ERROR: cannot treat sub-{subject_number} because of missing conditions (subject ID, data, contrasts dictionnaries).")
continue
anatomical_img = load_anatomical_image(subject_number)
concat_fmri_img, n_scans_list = load_functional_images(subject_number)
if MRI_trigger_notzero:
print("MRI trigger not equal to t0 - time reajusted")
else:
print("MRI trigger equal to t0 - time not reajusted")
if include_confounds:
print("Confounds from fMRIprep included in design matrix")
else:
print("Confounds from fMRIPprep not included in design matrix")
# treating STIM if conditions are filled
design_types = {
"stim": conditions["stim"],
"stim_o": conditions["stim_o"],
"stim_v": conditions["stim_v"],
"trial": conditions["trial"]
}
for design_type, should_process in design_types.items():
if not should_process:
continue
print(" ")
if design_type == "trial":
design_matrix = create_trial_design_matrix(subject_number, run_numbers, include_confounds, design_type, n_scans_list)
else:
design_matrix = create_stimulus_design_matrix(subject_number, run_numbers, include_confounds, design_type, n_scans_list)
print(" ")
glm = fit_glm(subject_number, design_matrix, design_type, concat_fmri_img)
print(" ")
contrasts_list = create_contrasts(design_matrix, design_type, subject_number)
print(" ")
for contrast_name, contrast_vector in contrasts_list.items():
generate_report(glm, {contrast_name: contrast_vector}, subject_number, design_type)
print(" ")
save_results_as_bids(glm, contrasts_list, subject_number, design_type)
print(f'\nFinished processing subject {subject_number} at {time.ctime(time.time())}\n')
overall_end_time = time.time()
overall_elapsed_time = overall_end_time - overall_start_time
minutes = int(overall_elapsed_time // 60)
seconds = int(overall_elapsed_time % 60)
print("\n-------------------------------------")
print(f"Total time elapsed for {len(subject_numbers)} subjects: {minutes}min{seconds:02d}s")
if __name__ == "__main__":
main()
PS: sorry for multiple posts, the forum’s bot told me to use quotes instead.