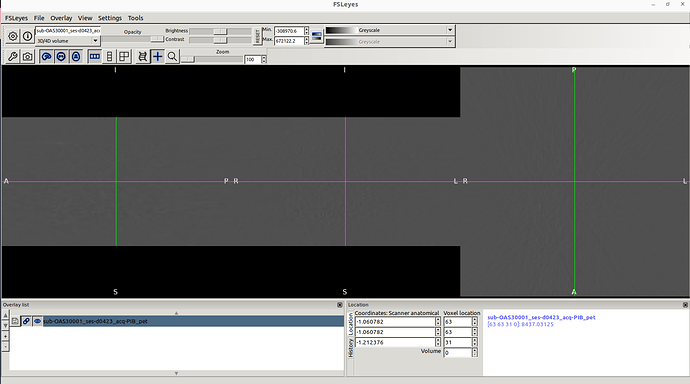
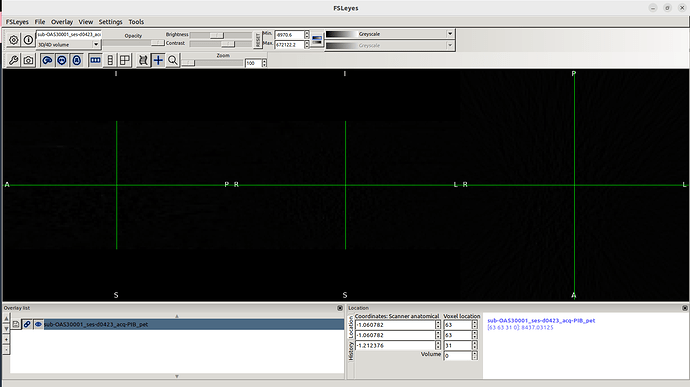
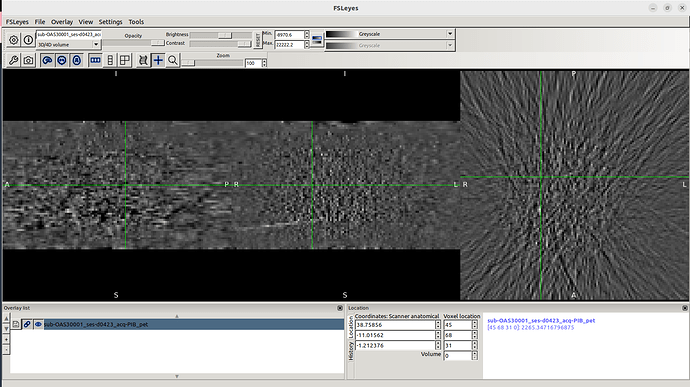
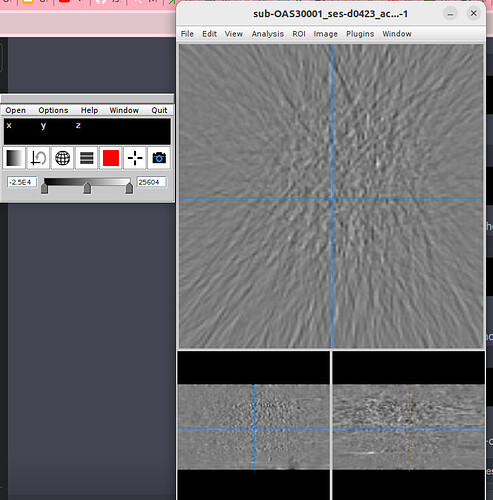
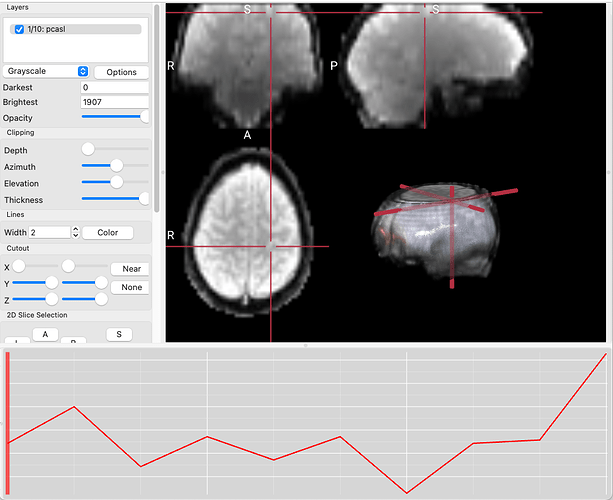
This is what I see whenever I drag a PET image in Fsleyes.
I clearly see the MRI and CT images from Oasis 3 dataset.
However, I don’t know why PET images don’t appear.
Hi @Yasmine,
Your min and max intensities look to be very large (such that everything looks like 0 because you have such a large total range). Can you try narrowing that range and see if something changes?
Best,
Steven
Have you tried any other viewing program? Do you have any way of confirming the acquisition is not corrupted in anyway?
May you recommend another viewing program?
I don’t really have any confirmation other than the fact that I downloaded the images from XNAT. And the sizes are large enough for nii files.
In that case, I doubt it’s a problem with the viewer, and probably something with the image. I don’t know enough about PET to troubleshoot that, sorry.
I would suggest a visualization tool that provides a timeline for selecting volumes within a 4D dataset. For example, you can drag-and-drop your images on this NiiVue live demo. Alternatively, try MRIcroGL.
The important thing to recognize is that PET scans are Emission scans, that will have only baseline signal before a contrast is provided (e.g. a radiotracer is injected). This is unlike CT scans which are transmission scans (measuring how different tissues attenuate XRays). An analogy is a camera photograph in an otherwise dark room: a PET scan is like a photograph of a lightbulb in the dark room which will show nothing if the light bulb is off, while a CT scan is like a photograph of a dark room where the camera uses a flash to illuminate the scene.
So the important thing is that if the initial volume was acquired before the radiotracer reached the brain, you should not expect much brain signal. Subsequent volumes will reveal signal as the tracer arrives.
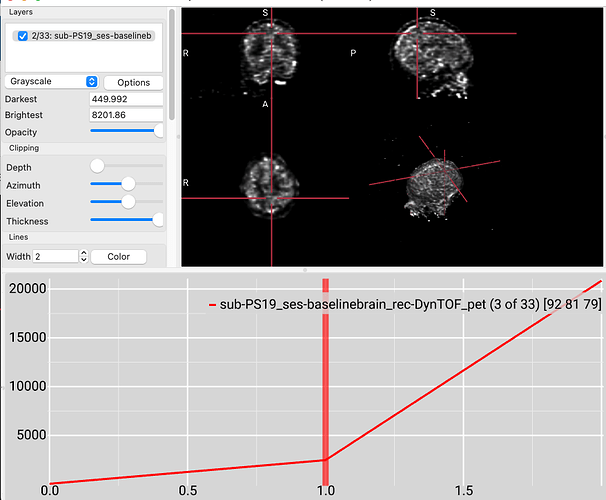
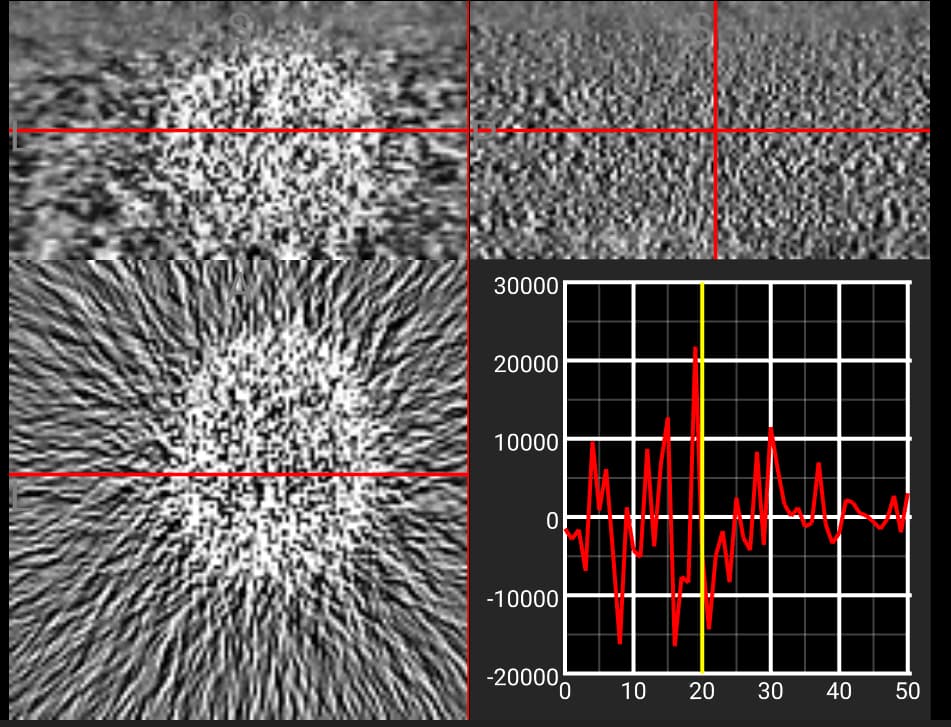
The OASIS datasets require a registration process, so are not ideal for replication. However, to see the issue look at some of the PET images on OpenNeuro, like this one. Notice that the first baseline volume only has noise, while subsequent volumes show clear signal from tissue with radiotracer uptake. The timeline at the bottom of MRIcroGL allows you to select a volume from the timeseries, and also shows the intensity of the selected voxel across time points. Note that the signal from this voxel was 0 for the first volume, but increases dramatically for subsequent volumes.
