Changing the colorbar axis limits using `nilearn.plotting.plot_img_on_surf()`

Hello!

Does anyone know if there is an easy way to change the color bar range to only display negative values using the plotting.plot_img_on_surf() function in nilearn?

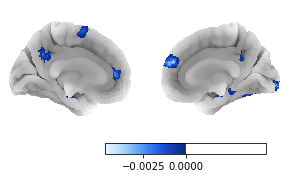
I have a brain image that only contains negative values, but the color bar still displays a symmetric range from negative to positive. I also tried adding a vmax=0 and vmax=-0.0001 argument without any luck.

I am using nilearn version 0.8.1.

Here is my relevant code:

from nilearn import plotting
stat_img = nib.load('example.nii.gz')

fig, axes = plotting.plot_img_on_surf(stat_img,
                              views=['lateral', 'medial'],
                              hemispheres=['left', 'right'],
                              threshold=0.00001,
                              cmap='blue_orange',
                              colorbar=True)

Thanks!
Shawn

Does the following help: axes[-1].set_xlim((vmin, 0))
Best,
Bertrand

Thanks so much! This is closer to what I am looking for, except the color bar outline still extends further to the right side. See below:

image

OK, I don’t find an easy fix. It looks like a bug. Maybe you could try with plotly ?

I know this question is pretty old at this point, but I ran into the same problem. But in the chance it may help you or someone else in the future, I fixed this by changing the suggested line from @bthirion from xlim to ylim.

In the case of your code, it would look something like this

fig = plotting.plot_img_on_surf(stat_img,
                              views=['lateral', 'medial'],
                              hemispheres=['left', 'right'],
                              threshold=0.00001,
                              cmap='blue_orange',
                              colorbar=True)
fig.axes[-1.set_ylim((vmin, 0))

Of note, you do need to define vmin to your lowest value, which it looks like you already did.