I have 3 questions related to what is represented in the figure below ( extracted from this video on YT)
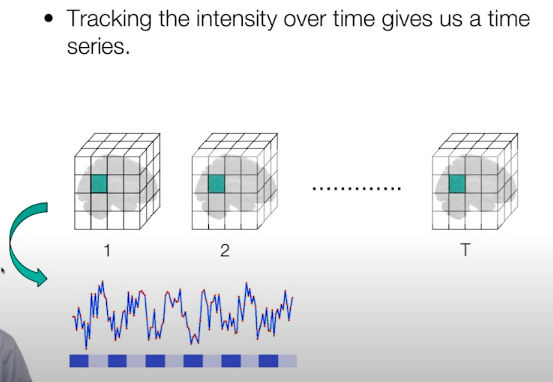
The image shows the signal intensity of a voxel over time. In the time series, the first point is associated with the voxel highlighted in the first volume, the second point is associated to the same voxel in the second volume, and so on. Just below the line chart, there is a simple representation of the design (block design alternating task and rest) that helps to associate the measured activity with the blocks.
QUESTION 1 The author of the video says that this time series shows the signal intensity of a voxel over time. Am I correct if I state one of the following?
A) The time series in the figure represents the “BOLD signal related to a single Voxel”
B) The time series in the figure represents the “HRF of a single Voxel”
QUESTION 2 If one wishes to obtain a time series for a given brain structure (e.g. hippocampus), would be correct to average the time series of all the voxels included in the hippocampus?
QUESTION 3 So often, the terms HRF and BOLD are used interchangably. I was reading many papers but I could not find a better definition that the following:"The hemodynamic response function (HRF) characterizes changes in BOLD signal over time"
We could say in other words that the BOLD signal is made of consecutive HRFs?
I am a bit hesitant to answer these questions myself and will be happy for input from some more experienced people, but I think for Question 1 statement A) seems correct. B) I am not so sure about, as the HRF as I understand it is simply the function of what the BOLD signal should look like in response to a stimulus, i.e. what we expect it to look like in an idealised way. I think Andy’s brain book has a nice section on the HRF
For question 2 I would say, yes, that seems like fairly standard practice to do that. There are other ways of doing that as well, but it depends on the research goal.
Question 3, not sure, I would not use them interchangeably. But maybe Andy’s brain book linked above will help clarify for you.
I’d agree with what @LeSasse said for the first two questions. For the third, there are a few things that are important in answering it.
what we measure as the BOLD signal includes non neuronal sources such as those relating physiological processes (respiration, heart beat), as well as noise. A lot of research is dedicated to characterizing and removing these in order to isolate neural processes.
to get our estimates of what the BOLD signal looks like, we use a mathematic process called convolution. For example, if we have a a 16 second task block, the estimated BOLD response from a place that performs that task is a rectangle (length 16 and amplitude 1) convoluted with the HRF.