Hello!
I am entirely new to neuroscience and EEG processing and currently trying to manually classify some ICA components that resulted from an EEG dataset. There is one component that looks easy at first glance, but after thinking about it and comparing it to the pictures on ICLabel I became more and more unsure about it. Due to the very limited topographical distribution, I guess this is either a hit or a miss:
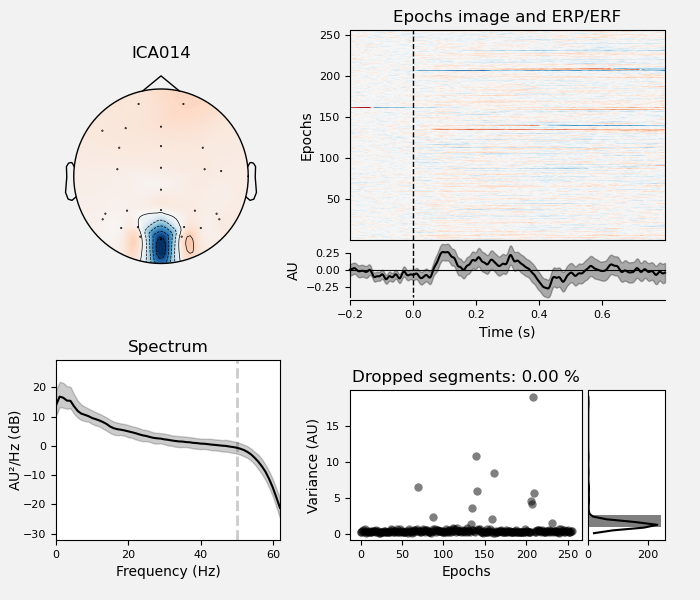
My first thought was that this depicts a clear brain component, supported by the power concentration in the low-frequency area. However, there seems to be only very less variance in the values and in the epochs image no pattern is visible that could indicate a relation to the stimulus. Compared to other components that are clearly brain components, the topological distributions seems to be too sharp to me (why is there only activity at one single channel?) which makes me think that this could also be some channel-related noise.
I am thankful for every hint. Thanks in advance!
Best,
javan