Colorbar in nilearn plot_stat_map cuts into brain when adding overlay

This is more of an aesthetic issue rather than a bug. I’m attempting to plot two contrasts in one image, using the following code:

cut_coordinates = [ -27, -5, -18]
bg_img = nilearn.image.load_img("/N/soft/rhel7/fsl/6.0.1b/data/standard/MNI152_T1_1mm_brain.nii.gz")

thresh_h_img = nilearn.image.load_img("thresh_h_zstat1.nii.gz") # A > B
thresh_l_img = nilearn.image.load_img("thresh_l_zstat1.nii.gz") # B > A

display = nilearn.plotting.plot_stat_map(thresh_h_img,
                                         display_mode="ortho",
                                         bg_img=bg_img,
                                         black_bg=False,
                                         draw_cross=False,
                                         annotate=True,
                                         colorbar=True,
                                         cmap="jet",
                                         cut_coords=cut_coordinates,
                                         threshold=4.05,
                                         symmetric_cbar=True,
                                         )

display.add_overlay(thresh_l_img, cmap=blues_cmap)

This results in the following image:
Screen Shot 2023-02-13 at 4.48.17 PM

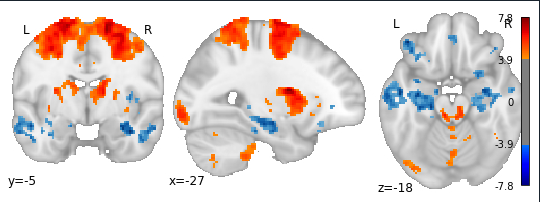
I’ve been having trouble preventing the colorbar from encroaching into the z-slice, and was wondering whether there’s a way to prevent this in nilearn or if this is handled in matplotlib?

Hi @dlevitas,

This is just a matplotlib thing. You can create your own bigger figure/axes instance using matplotlib and then pass it in to the plot_stat_map function with the figure / axes argument.

Best,
Steven

Hi @Steven,

Can you clarify how you do that? I’ve tried inserting a blank figure with different sizes, but the colorbar issues continues once I set the display.add_overlay().

cut_coordinates = [ -27, -5, -18]
bg_img = nilearn.image.load_img("/N/soft/rhel7/fsl/6.0.1b/data/standard/MNI152_T1_1mm_brain.nii.gz")

thresh_h_img = nilearn.image.load_img("thresh_h_zstat1.nii.gz") # A > B
thresh_l_img = nilearn.image.load_img("thresh_l_zstat1.nii.gz") # B > A

fig = plt.figure(figsize=(6,3)).tight_layout(pad=0, w_pad=0, h_pad=0)

display = nilearn.plotting.plot_stat_map(thresh_h_img,
                                         display_mode="ortho",
                                         bg_img=bg_img,
                                         black_bg=False,
                                         draw_cross=False,
                                         annotate=True,
                                         colorbar=True,
                                         cmap="jet",
                                         cut_coords=cut_coordinates,
                                         threshold=4.05,
                                         symmetric_cbar=True,
                                         figure=fig
                                         )

display.add_overlay(thresh_l_img, cmap=blues_cmap)