Compute mixed model with nested fixed and nested random effects

Note: This post is more or less a copy of this Cross Validated thread. I decided to also post it here to reach a community of people that might have a better intuition of what I want because auf the relation to neuroimaging:

I have a dataset that contains a nested structure, which I want to address with a mixed model to test my hypothesis. For each subject in this data set, I have data for 376 brain regions, and for each brain region I have activation values for 12 transitions that each of the brain regions “go through”. I am interested in finding out if they are differences in values between brain regions across all subjects and across all transitions (Note: The order of the transitions does not matter but should be treated as a categorical variable). I have a first intuition of what I want, but I struggle with the translation of my problem into a formal mathematical model that can handle this problem. Here are a few thoughts in plain English that sum up this first intuition:

I “don’t care” about subject differences, in other words, I could also just average all subjects and look at the average subject or treat every subject as a random draw from a distribution. Same with the transitions: I don’t care about differences between transitions. Rather I am interested if regions differ on average across transitions. Every region belongs to a subject and therefore it is nested within that subject (nested fixed effect?). Similarly, for each region within each subject, I have data from 12 transitions. Here I am a little bit unsure how to model this, as a nested or a crossed random effect?

@Shotgunosine: Maybe you as a co-developer of the pymer4 package can come up with the right formula? :slight_smile: I would love to use your package, so I can stick to Python and would not have to switch to R.

Greetings,

Johannes

Hi Johannes,

Sorry I just saw your message. I’m not 100% sure that I understand your question. (Also, to be clear, calling me a co-developer of pymer4 is an exaggeration of my input to that project, but I’m happy that you’re interested in using it.) You say that you don’t care about differences between transitions, rather that you are interested if regions differ on average across transitions. What I take that to mean is you don’t care what the mean value in each region for each transition is, you just want to see if transition has an effect on the value in each region. Is your goal to determine which regions transitions has an effect on? If so, I might fit one model per region and then use an FDR procedure to deal with multiple comparisons. The ANOVA method is how I would run the test given that you don’t care about which transitions are different. Roughly, this is what you’d do:

formula = "value ~ transition + (1 | subject)"
factors = {'transition': ['t_1', 't_2', 't_3', 't_4', 't_5', 't_6', 't_7', 't_8', 't_9', 't_10', 't_11', 't_12']}
model = Lmer(formula, data=data)

model.fit(factors=factors)

anova_res = model.anova()
print(anova_res)

Based on how I’ve interpreted the question you’re asking, I wouldn’t include all of the regions in the same model. If you’ve got multiple values for each transition from each region of each subject, then you should change the random effect structure to (transition | subject) but if you’ve just got one value per transition per region per subject, then all you can do is an intercept term per subject (1 | subject).

Best of luck,

Dylan

Dylan! Thanks so much for the response! I think we’re getting close, but we’re still not quite on the same page. I’ll add a code example to give you a better intuition for the problem. But first:

What I take that to mean is you don’t care what the mean value in each region for each transition is, you just want to see if transition has an effect on the value in each region. Is your goal to determine which regions transitions has an effect on?

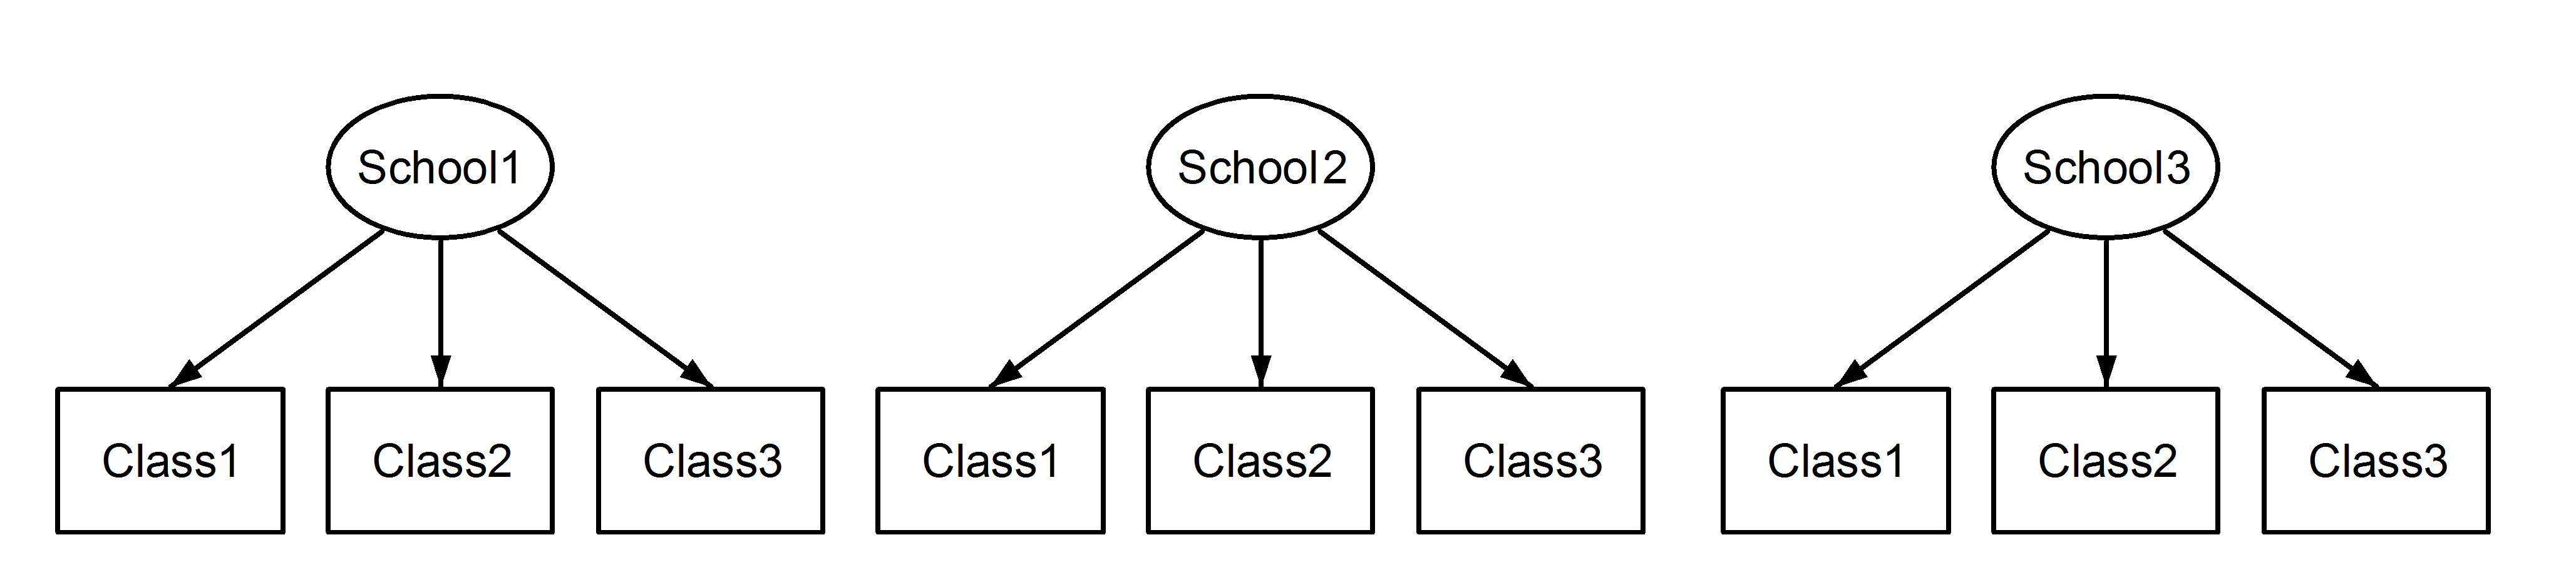
Nope! It’s the opposite way around. I do care about the mean value for each region over the transitions (but I don’t care about the individual differences between transitions). Instead, you can think of the transitions as different samples for each region. Just like you would ask the question: “I know that people’s mood is different over time. But are some people happier than others across all timepoints?”

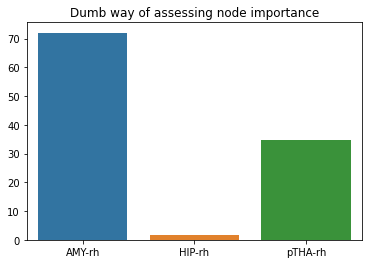
Another way to phrase it: I would like to measure the mean value for each region across transitions, to have an estimate for how ‘important’ that region is across different transitions. Since I have to assume that subjects systematically differ in their overall baselines, I (probably) need to use a method which takes that into account (aka. ask that same question for each subject individually).

Here’s a code example with a (probably dumb) method of how to do it (which does however, what I want):

import numpy as np
import pandas as pd
from scipy.stats import ttest_1samp
import seaborn as sns

# let's get some (real) example data with only 2 subjects (in reality it's ~ 500), 3 transitions, 
# (in reality it's 12) and 3 regions (in reality it's 376)
df = pd.DataFrame( {'subject_id': {0: 'subject_1', 1: 'subject_1', 2: 'subject_1', 
                                   3: 'subject_1', 4: 'subject_1', 5: 'subject_1', 
                                   6: 'subject_1', 7: 'subject_1', 8: 'subject_1', 
                                   9: 'subject_2', 10: 'subject_2', 11: 'subject_2', 
                                   12: 'subject_2', 13: 'subject_2', 14: 'subject_2', 
                                   15: 'subject_2', 16: 'subject_2', 17: 'subject_2'}, 
                    'transition_name': {0: 't_1', 1: 't_1', 2: 't_1', 3: 't_2',
                                        4: 't_2', 5: 't_2', 6: 't_3', 7: 't_3',
                                        8: 't_3', 9: 't_1', 10: 't_1', 11: 't_1',
                                        12: 't_2', 13: 't_2', 14: 't_2', 15: 't_3',
                                        16: 't_3', 17: 't_3'}, 
                    'node_name': {0: 'HIP-rh', 1: 'AMY-rh', 2: 'pTHA-rh', 3: 'HIP-rh',
                                  4: 'AMY-rh', 5: 'pTHA-rh', 6: 'HIP-rh', 7: 'AMY-rh',
                                  8: 'pTHA-rh', 9: 'HIP-rh', 10: 'AMY-rh', 11: 'pTHA-rh',
                                  12: 'HIP-rh', 13: 'AMY-rh', 14: 'pTHA-rh', 15: 'HIP-rh',
                                  16: 'AMY-rh', 17: 'pTHA-rh'}, 
                    'value': {0: 18.169628442050033, 1: 2453.740158396672, 2: 
                              23.941483293259502, 3: 65.4016090514235, 
                              4: 3.283942478187501, 5: 67.43542817427837, 
                              6: 2162.7234920346027, 7: 7655.829395438006, 
                              8: 211.22679142416803, 9: 1244.4375520435424, 
                              10: 1.4496241718039369, 11: 528.1145899402427, 
                              12: 2077.8338111876874, 13: 550.7483033777041, 
                              14: 185.7183214382474, 15: 861.6458143820387, 
                              16: 159.5386394755295, 17: 67.99382988159742}} )
    
# and here's a (probably very dumb) way to do it
all_subjects_ttests = []

# iterate over each subject
for subject_id,subject_df in df.groupby('subject_id'):
    
    # now iterate over each node within each subject and compute a one-sample
    # t-test with all transitions as samples. Save the resulting t-values 
    single_subject_ttests = []
    for node_name, node_df in subject_df.groupby('node_name'):
        print(node_name)
        t,_ = ttest_1samp(node_df['value'],popmean=0)
        single_subject_ttests.append(t)
    
    # save the results of each subject so that you end up with a list of lists
    # of t-values
    all_subjects_ttests.append(single_subject_ttests)

# now again compute t-tests using the t-values but this time take the subjects
# as samples
all_subjects_ttests = np.array(all_subjects_ttests)
ts,_ = ttest_1samp(all_subjects_ttests, popmean=0)

sns.barplot(x=['AMY-rh','HIP-rh','pTHA-rh'],y=ts).set_title('Dumb way of assessing node importance')

image

Ok, if I’m following correctly, then you’re interested in the intercept.

formula = "value ~ 1 + (1 | subject) + (1 | transition)"
model = Lmer(formula, data=data)

model.fit()
dfFixef = model.fixef

The intercept term from dfFixef should be what you’re looking for, the p-values will probably be valid, but pay attention to the degrees of freedom and make sure they don’t look unreasonably high. You could then use your multiple comparisons method of choice to correct for evaluating all of the ROIs.

Ok, if I’m following correctly, then you’re interested in the intercept.

Yes! Now that you’re saying that, that makes sense. But are you sure that this is right?

formula = "value ~ 1 + (1 | subject) + (1 | transition)"

Shouldn’t it be:

formula = "value ~ 1 + (1 | subject) + (1 | node_name)"?

Because right now, I receive intercept values for each transition but not for each node?

The intercept term from dfFixef should be what you’re looking for, the p-values will probably be valid, but pay attention to the degrees of freedom and make sure they don’t look unreasonably high.

Alright, but what would be a high number of degrees of freedom? And how to obtain the p-values? Should I get one for each node intercept? They are not found in model.fixef. Can I obtain them from model?

You’ll need to fit a separate model for each node. Apologies, I was wrong about where to find the results. If I’m reading the example here correctly, model.coefs will have the Intercept fixed effect, t-value, degrees, of freedom, and p-value. A high number of degrees of freedom in this case would probably be a value much larger than the number of subjects.

Ah! Interesting, I thought, the intercepts for each node could be somehow modeled using only one “big model” including regions, subjects and transitions (this is also why I interpreted your formula wrong). Anyways, sooner or later one has to correct for the p-values/t-values of n regions, whether produced by n models or by just using one.

model.coefs will have the Intercept fixed effect, t-value, degrees, of freedom, and p-value.

Perfect! Thanks so much :slight_smile:

Maybe one last question before closing this post. What was your intuition for using

formula = "value ~ 1 + (1 | subject) + (1 | transition)"

instead of:

formula = "value ~ 1 + (1 | subject) + (1 | subject: transition)"

If I didn’t understood something wrong, you would suggest using a crossed model instead of a nested one?

Yeah, you’ll still need to do a multiple comparisons correction.

Regarding a crossed vs nested model, it depends on how transitions are defined. If the identity of the 12 transitions is the same across individuals, then it’s a crossed model (this is what I had assumed). From the example you linked:


With participants replacing school and transition replacing class. If on the other hand transition 1 in subject 1 is unrelated to transition 1 in subject 2, then a nested model would be more appropriate.

Yes, I think a nested model would be more appropriate but I am also not 100% sure. A crossed-model would assign each value from each transition to every subject right? If I get it correctly, in a nested model, each subject would have 12 values for each node (subject x would have 12 values for node y and subject z would also have 12 values for node y). But in a cross model, each subject would be also assigned with every other 12 values from all other subjects? I guess that’s not what I want…

I don’t think your intuition about crossed vs nested mixed effects is quite right. If transitions are expected to have an effect that’s shared across individuals, then it should be modeled as crossed. The model will fit one intercept term for each transition across individuals representing the common effect of that particular transition across everyone. Additionally, the model will fit an intercept for each subject, representing the unique offset of that subject across all transitions.

Apparently I seem to be in the same state of confusion as the OP from the Cross Validated thread. Interestingly however, both models give the same result for the node intercepts. I have the feeling though, that I now better understand the difference between crossed and nested models (I hope at least…?). Let’s make another example: Let’s pretend the nodes would be different conditions (while or before corona) where people would be asked how much they like the sea, the mountains or a lake as their holiday location. We could expect that generally people give lower or higher scores to any of that places when asked while or after Corona (= Systematic effects of nodes, where I do have a hypothesis about which nodes should have a higher or lower ranking). We could also expect that some people in general give higher or lower scores regardless if it’s the sea, the mountains or a lake and regardless if they are asked during or after Corona (“high-scorers” vs. “low-scorers”). But for a crossed model, we would also argue, that people in general share a tendency give some of the places a higher ranking than others right? If that’s true, I don’t know if this can be translated to my data, because I wouldn’t argue that some transitions have systematic effects (at least I don’t know, of course that could be the case, but I don’t have a clear hypothesis for that).

In general, the structure of the mixed effects should reflect the structure of the data. I’m not sure how you’ve defined these transitions, so I can’t answer the question for sure. The way I would approach it though is this. Does transition 1 represent the same thing in all subjects, or does each person have a uniques set of transitions?

If transition 1 represents the same thing across subjects, and transition 2 does and so on, then you’ve got crossed random effects. There exists the potential for subjects and transitions to each independently contribute variance to the value measured in each ROI. In my opinion, the likelihood of each of those actually contributing variance doesn’t matter, the random effects should represent the structure of the data.

On the other hand, if transitions are unique things within each individual, they’re nested.

The answer to that question should be clear from the procedure you used to define the transitions. If transitions are defined with some sort of across subject procedure, then it’s probably the case that each transition represents the same thing across people, and you’ve got crossed random effects. If transitions are defined by some sort of within subject procedure, and there’s not a step that attempts to align transitions across individuals (such as a Procrustes transformation), then it’s nested.

Like you said, the fixed effects are the same in either case, so in this instance the distinction may not be super important, but that’s how I would think through the decision.

1 Like

If transitions are defined by some sort of within subject procedure, and there’s not a step that attempts to align transitions across individuals (such as a Procrustes transformation), then it’s nested.

Each transition is computed within each subject, so basically this comes most close to my question. You could expected certain group effects because each transition is defined by a source and target state, derived from fMRI (my source and target states are statistical images from the HCP fMRI tasks). So of course we could argue that the “nback”-state looks roughly the same across subjects. But only roughly of course, there are still differences between subjects. And since each statistical image is computed in subject specific 1-st level models there is not information leakage across subjects. I will stick for now to the nested design. Thanks so much for your help Dylan!!