Hi folks,
I am trying to compute the tSNR in specific ROI. I have 2 subjects, 2 ROI, and each subject did 12 functional runs containing 18 trials (134 TR each). In this scenario, I want to obtain the mean tSNR over all trials and runs for each subject and ROI, looking like this (arbitrary values):
| subject | roi1 | roi2 |
|---|---|---|
| sub-03 | 10 | 75 |
| sub-04 | 33 | 49 |
To do so, I:
-
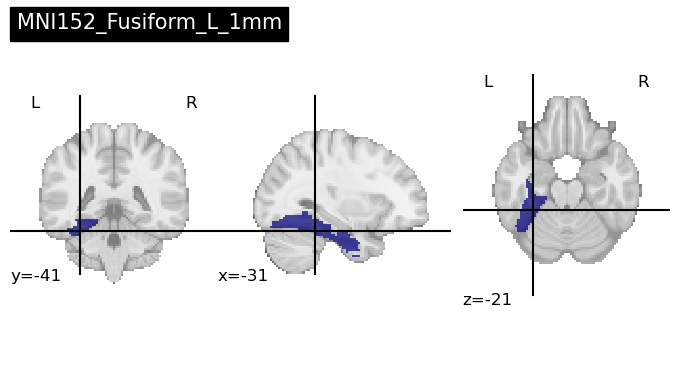
define specific ROI using aal MNI atlas
.niifiles (ex: MINI152_Fusiform_L_1mm) - seems OK
-
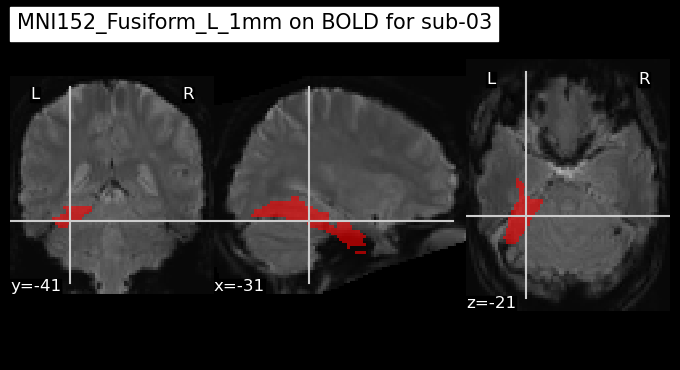
load the functional images (12 per subjects), and check if one mean run aligns correctly with the ROI - seems OK
-
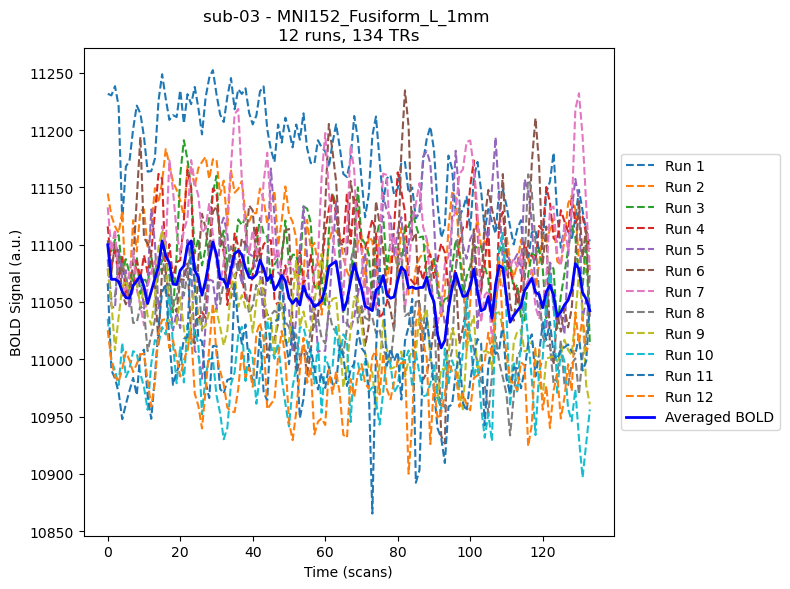
Compute the BOLD signal for each runs in that ROI, as well as the mean BOLD signal, using the
NiftiLabelsMaskerfunction from Nilearn without normalizing - seems OK
-
Compute the tSNR as the ratio mean / std over all the 13 time series
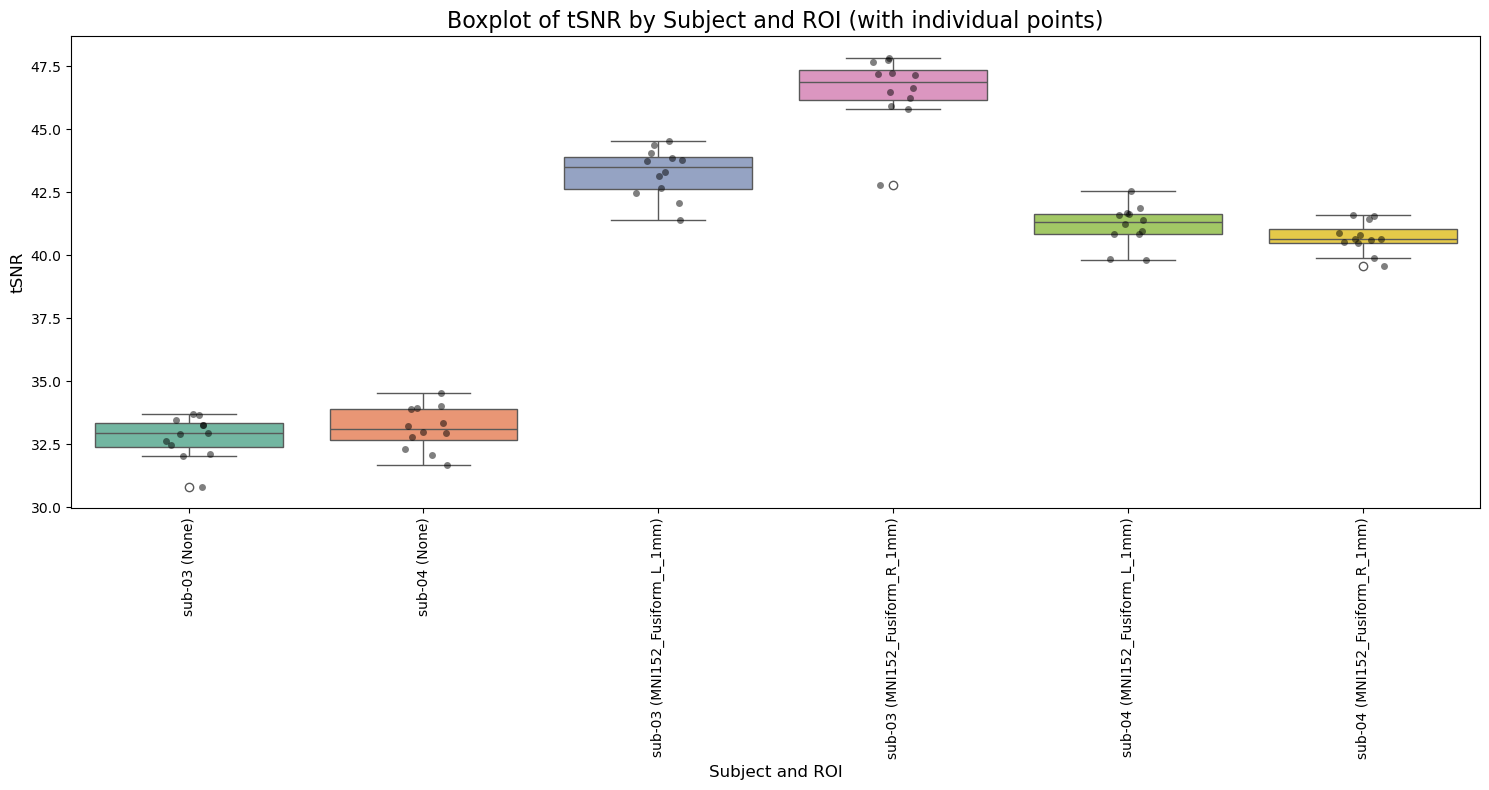
The issue I face is the particularly high value of tSNR I obtain (around 500-1000). I haven’t read about values higher than ~100-150 in the literature. This is what I obtain:
| subject | MINI152_Fusiform_L_1mm | MINI152_Fusiform_R_1mm |
|---|---|---|
| sub-03 | 658 | 614 |
| sub-04 | 676 | 828 |
What am I doing wrong in the computation ? For instance, the BOLD values for sub-03 in MINI152_Fusiform_L_1mm are around ~1100 for each TR in each run (and so is the mean BOLD TS):
| TR | run-01 | run-02 | … | mean_BOLD_signal |
|---|---|---|---|---|
| 0 | 11231 | 11144 | … | 11099 |
| 1 | 11173 | 11098 | … | 11069 |
| etc | … | … | … | … |
And the obtained tsnr:
| run | tsnr |
|---|---|
| run-01 | 255 |
| run-02 | 320 |
| … | … |
| combined | 658 |
On the opposite, if I normalize the values of my BOLD signal, I obtain tSNR values close to 0 (0.0000123, 0.00000341, etc). What should I do?
Here is my full code for the record
import os
import sys
import glob
import numpy as np
import nibabel as nib
from nilearn import image, masking, plotting
from nilearn.image import resample_to_img, mean_img
import argparse
import re
import time
from datetime import datetime
import json
import matplotlib.pyplot as plt
import pandas as pd
import seaborn as sns
from nilearn.maskers import NiftiLabelsMasker

#------------- Parameters ----------------
data_location = "nilearn_se"
subjects_of_interest = [
    "03",
    "04"
    ]
rois = [
    "MNI152_Fusiform_L_1mm",
    "MNI152_Fusiform_R_1mm"
    ]  # Example ROIs

save_mean_BOLD_csv = True
save_tsnr_csv = True
plot_ROI_of_interest = True
plot_BOLD_TSA = True
debug = True
#------------- Parameters ----------------

subjfolder = datetime.today().strftime("%Y%m%d")
current_directory = os.getcwd()
bids_path = os.path.abspath(os.path.join(current_directory, '..', f"{data_location}", "bids"))
fmriprep_path = os.path.abspath(os.path.join(current_directory, '..', f"{data_location}", 'fmriprep'))
roi_path =  os.path.abspath(os.path.join(current_directory, '..', f"{data_location}", 'anatomy', 'aal3'))
output_dir = os.path.abspath(os.path.join(current_directory, '..', "results", "tsnr", subjfolder))
os.makedirs(output_dir, exist_ok=True)

print(f"Current directory: {current_directory}")
print(f"Data location: {data_location}")
print(f"Subjects of interest: {subjects_of_interest}")
print(f"ROIs: {rois}")
print(f"BIDS path: {bids_path}")
print(f"input directory: {fmriprep_path}")
print(f"atlas directory: {roi_path}")
print(f"output directory: {output_dir}")

if debug:
    print("Debug mode is ON")
elif debug == False:
    print("Debug mode is OFF")

def plot_rois(rois, roi_path):
    """Plot the ROIs of interest using nilearn.plotting."""
    if debug:
        print("--DEBUG Visulaising ROI(s) of interest")
        for roi in rois:
            roi_mask = os.path.join(roi_path, f"{roi}.nii")
            plotting.plot_roi(roi_mask, title=f"{roi}", threshold=0.5, alpha=0.7,
                            cmap='gist_ncar', draw_cross=True, linewidths=2.5)
            plt.show()


def extract_mean_bold(subject, rois, fmriprep_path, roi_path):
    """Extract mean BOLD time series for a subject across multiple ROIs."""
    print(f"Extracting mean BOLD for subject {subject}...")

    extracting_mean_bold_start = time.time()

    subject_func_dir = os.path.join(fmriprep_path, f"sub-{subject}", "func")
    func_imgs = sorted([
        os.path.join(subject_func_dir, f) for f in os.listdir(subject_func_dir)
        if f.endswith("space-MNI152NLin2009cAsym_desc-preproc_bold.nii.gz")
    ])

    if debug and func_imgs:
        first_func_img = func_imgs[0]
        print(f"--DEBUG Visualizing ROIs on first BOLD image of subject {subject}")
        mean_bold_img = mean_img(first_func_img)

        for roi in rois:
            roi_mask = os.path.join(roi_path, f"{roi}.nii")
            plotting.plot_roi(roi_mask, bg_img=mean_bold_img, title=f"{roi} on BOLD for sub-{subject}", threshold=0.5,
                              alpha=0.6, draw_cross=True, cmap="autumn", linewidths=2.0)
            plt.show()

    bold_data = {}

    for roi in rois:
        roi_mask = os.path.join(roi_path, f"{roi}.nii")
        masker = NiftiLabelsMasker(labels_img=roi_mask, standardize=False)  # Set standardize=False to avoid mean centering which screws with tsnr

        all_bold_signals = []

        for func_img in func_imgs:
            timeseries = masker.fit_transform(func_img)
            mean_bold = np.mean(timeseries, axis=1)
            all_bold_signals.append(mean_bold)

        mean_bold_combined = np.mean(all_bold_signals, axis=0)
        bold_data[roi] = {
            'runs': all_bold_signals,
            'combined': mean_bold_combined,
            'n_runs': len(func_imgs),
            'n_timepoints': len(mean_bold_combined)
        }

    print(f"Extracted mean BOLD in {time.time() - extracting_mean_bold_start:.2f} seconds")

    return bold_data

def save_mean_bold_signal(subject, roi, bold_info, output_dir):
    """
    Save the BOLD time series (all runs + average) for a subject and ROI as a CSV.

    Parameters:
    - subject (str): Subject ID
    - roi (str): Name of the ROI
    - bold_info (dict): Contains 'runs' (list of 1D arrays) and 'combined' (averaged 1D array)
    - output_dir (str): Directory to save the file
    """
    print("Saving detailed BOLD time series to CSV...")
    os.makedirs(output_dir, exist_ok=True)
    filename = f"sub-{subject}_BOLD-TSA_{roi}.csv"
    filepath = os.path.join(output_dir, filename)

    # Create a DataFrame from the individual runs
    df = pd.DataFrame()
    for i, run_signal in enumerate(bold_info['runs']):
        df[f"run-{i+1:02d}"] = run_signal

    # Add the averaged signal as an extra column
    df["mean_BOLD_signal"] = bold_info["combined"]

    # Save with TRs as index
    df.to_csv(filepath, index_label="TR")

    print(f"Saved mean BOLD signal CSV: {filepath}")

def plot_bold_time_series(subject, roi, bold_info):
    """Plot the BOLD time series for a subject and ROI."""
    print(f"BOLD time series for subject {subject} in ROI {roi}:")
    plt.figure(figsize=(8, 6))

    for i, run_bold in enumerate(bold_info['runs']):
        plt.plot(run_bold, label=f"Run {i+1}", linestyle='--')

    plt.plot(bold_info['combined'], label="Averaged BOLD", color="b", linewidth=2)
    plt.xlabel("Time (scans)")
    plt.ylabel("BOLD Signal (a.u.)")
    plt.title(f"sub-{subject} - {roi} \n{bold_info['n_runs']} runs, {bold_info['n_timepoints']} TRs")
    plt.legend(loc='center left', bbox_to_anchor=(1, 0.5))
    plt.tight_layout()
    plt.show()

def compute_tSNR(data):
    """
    Compute tSNR from a 1D time series (e.g., average BOLD signal in ROI).
    """
    mean_signal = np.mean(data)
    std_signal = np.std(data)

    if std_signal > 1.0e-6:
        tsnr = mean_signal / std_signal
    else:
        tsnr = np.nan

    if debug:
        print(f"mean: {mean_signal:.3f}, std: {std_signal:.3f}, tSNR: {tsnr:.3f}")

    return tsnr, mean_signal, std_signal


def compute_SFNR(mean_signal, noise_std):
    """
    Compute SFNR (Signal Fluctuation to Noise Ratio) for the ROI.
    """
    sfnr = np.zeros_like(mean_signal)
    valid = noise_std > 1.0e-3
    sfnr[valid] = mean_signal[valid] / noise_std[valid]

    return sfnr


def extract_metrics_for_all_runs(subject, roi, bold_info):
    """
    Compute tSNR and SFNR for each run and the combined mean for the subject and ROI.
    """
    tsnr_values = []
    sfnr_values = []
    run_metrics = []

    # Loop through each run
    for i, run_bold in enumerate(bold_info['runs']):
        tsnr, mean_signal, std_signal = compute_tSNR(run_bold)
        sfnr = compute_SFNR(mean_signal, std_signal)

        # Store tSNR and SFNR for each run
        tsnr_values.append(np.nanmean(tsnr))  # Taking mean of tSNR over time
        sfnr_values.append(np.nanmean(sfnr))  # Taking mean of SFNR over time

        # Store individual run metrics
        run_metrics.append({
            'run': f'run-{i+1:02d}',
            'tsnr': np.nanmean(tsnr),
            'sfnr': np.nanmean(sfnr),
            'mean_signal': np.nanmean(mean_signal),
            'std_signal': np.nanmean(std_signal)
        })

    # Compute tSNR and SFNR for the combined signal (mean of all runs)
    tsnr_combined, mean_signal_combined, std_signal_combined = compute_tSNR(bold_info['combined'])
    sfnr_combined = compute_SFNR(mean_signal_combined, std_signal_combined)

    # Add combined metrics
    run_metrics.append({
        'run': 'combined',
        'tsnr': np.nanmean(tsnr_combined),
        'sfnr': np.nanmean(sfnr_combined),
        'mean_signal': np.nanmean(mean_signal_combined),
        'std_signal': np.nanmean(std_signal_combined)
    })

    return run_metrics


def save_metrics_to_csv(subject, roi, run_metrics, output_dir):
    """
    Save the computed tSNR and SFNR metrics for each run (and combined) to a CSV file.
    """
    print("Saving metrics to CSV...")
    os.makedirs(output_dir, exist_ok=True)
    filename = f"sub-{subject}_tSNR_{roi}.csv"
    filepath = os.path.join(output_dir, filename)

    # Convert the list of metrics dictionaries to a DataFrame
    df = pd.DataFrame(run_metrics)
    df.to_csv(filepath, index=False)

    print(f"Metrics saved to: {filepath}")

def save_group_tsnr_summary(mean_bold_dict, subjects, rois, output_dir):
    """
    Save a CSV summarizing tSNR from the mean BOLD signal for all subjects and ROIs.

    Parameters:
    - mean_bold_dict: Dictionary with keys (subject, roi) and values being the combined mean BOLD signal
    - subjects: List of subject IDs
    - rois: List of ROI names
    - output_dir: Directory where the summary CSV will be saved
    """
    print("Saving group-level tSNR summary...")

    tsnr_summary = {}

    for subject in subjects:
        tsnr_summary[subject] = {}
        for roi in rois:
            bold_signal = mean_bold_dict.get((subject, roi))
            if bold_signal is not None:
                tsnr, _, _ = compute_tSNR(bold_signal)
                tsnr_value = np.nanmean(tsnr)
                tsnr_summary[subject][roi] = tsnr_value
            else:
                tsnr_summary[subject][roi] = np.nan  # missing data

    # Convert to DataFrame
    df = pd.DataFrame.from_dict(tsnr_summary, orient='index')
    df.index.name = 'subject'

    # Ensure ROI columns are in the original order
    df = df[rois]

    # Save to CSV
    os.makedirs(output_dir, exist_ok=True)
    filepath = os.path.join(output_dir, "group_tSNR_summary.csv")
    df.to_csv(filepath)

    print(f"tSNR summary saved to: {filepath}")

def main():
    start_time = time.time()
    mean_bold_dict = {}
    all_metrics_dict = {}  # To store the metrics for each subject and ROI

    plot_rois(rois, roi_path)

    for subject in subjects_of_interest:
        print(f"\nProcessing subject {subject}...")
        bold_data = extract_mean_bold(subject, rois, fmriprep_path, roi_path)

        for roi, bold_info in bold_data.items():
            mean_bold_dict[(subject, roi)] = bold_info['combined']

            # Save the mean BOLD signal
            if save_mean_BOLD_csv:
                save_mean_bold_signal(subject, roi, bold_info, output_dir)

            # Plot if requested
            if plot_BOLD_TSA:
                plot_bold_time_series(subject, roi, bold_info)

            # Compute tSNR and SFNR for each run and the combined signal
            print("Computing tSNR and SFNR...")
            run_metrics = extract_metrics_for_all_runs(subject, roi, bold_info)

            # Save the metrics to CSV
            save_metrics_to_csv(subject, roi, run_metrics, output_dir)

    # Save final group tSNR table
    save_group_tsnr_summary(mean_bold_dict, subjects_of_interest, rois, output_dir)

    print("\n-------------------------------------------------------------")
    print(f"tSNR completed in {time.time() - start_time:.2f} seconds")


if __name__ == "__main__":
    main()