Good day!
I use MNE Python for work with MEG data and now have I have confusion with epoched data on source space:(
I used mne.minimum_norm.source_band_induced_power function for conversion data (in beta frequency range) to souce space.
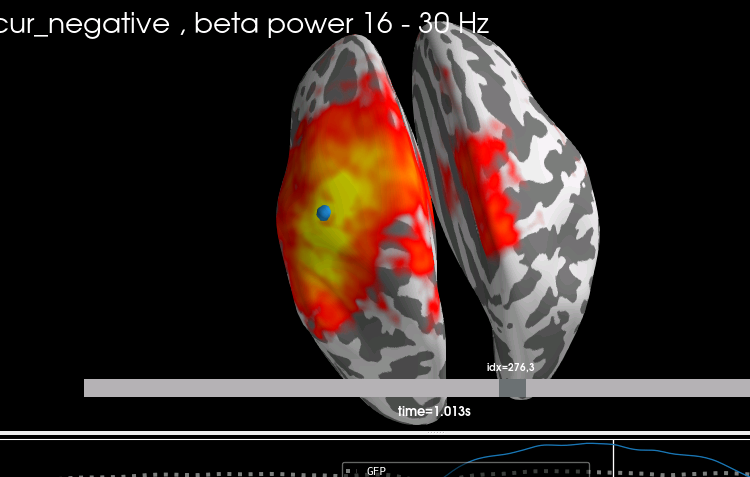
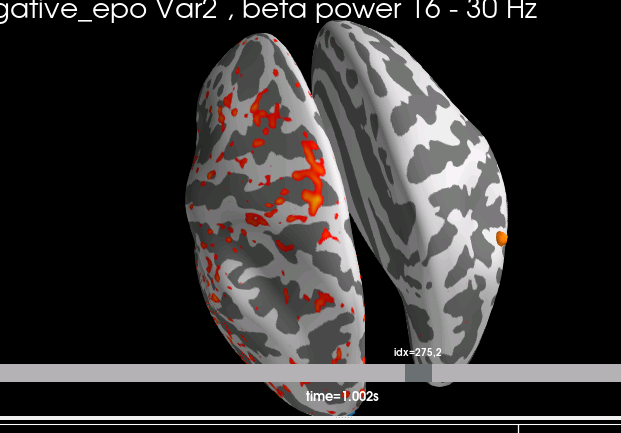
When I computed stc with mne.minimum_norm.source_band_induced_power and got data averaged by epochs, I morphed it on fsaverage and averaged between subjects, and plotted the result - I got picture with clear localization as I expected (Fig. 1). But when I computed stc for each epochs separately, then averaged data between epochs, morphed on fsaverage, then averaged between subjects - I got signal without clear localization, it appears to be smeared all over the hemisphere (although it is in that hemisphere and while expected) - Fig.2.
So I confused - I did something wrong with averaging stc for epochs, or can it be expected that the sources obtained from individual epochs may not be as clearly localized as those obtained from averaged data (since the inverse problem is solved here, and the signal from a separate epoch is noisier)?
I will be very thankfull for any hints, or or maybe there was a similar experience with MEG data in beta frequency range .