Hi all,
This is a repost from the question I made in a previous post in image.sc forum. I refined it to be more clear and concise.
Summary
I am working in the image analysis of a Rat model study. We have CT and PET whole body adquisitions. I have some experience applying SPM to human neuroimages, and they want me to apply this same analysis to this study. I manage to process the images to register them into the sigma atlas space, that is at the same time in the waxholm space, making use of the CT template. My preprocessing pipeline flow is as follows:
1. Skull strip
I create a label image of the skull and brain for each image on 3D slicer using the wrap solidiy package. I found this step challenging and time consuming since all the skull stripping tools I know are aim for human anatomy (tissue probability maps for unified segmentation in SPM and atropos in ANTS) and for MRI (same as before, plus BET from FSL), not CT. So basically I crop the image to the brain region, smooth the image, apply a contrast between 100 and 500 HU, manually clean it to obtain the skull structure and run wrap solidify to obtain the brain label.
2. Resample PET
I resample the PET image into the CT, using ANTSpyx - antsRegistrationSyN to do an affine transformation. I ensure that there was a visually correlation on the anatomy I could see in the PET image into the CT. (head, ears, etc).
3. Crop Brain
I extract the ROI of the brain according to the label image space I created for all the studies.
4. Rough aligment
Since ANTS antsRegistrationSyN script will only work if there was a coherent overlap between the images, I transform all studies (CT, label images, and resampled PETs) by an estimated linear transformation I determined (try and error) until the ROI of the brains roughly overlap the Sigma CT template.
5. Normalization
I run the AntsSyN with the rigid-affine and bsplines transformations parameter. As moving image I select the CT brain image masked by the skull label from the label image, and for the fixed image I select the CT (skull) template of the Sigma atlas. I applied the transformations to the rest of the images in each study (label and PET).
6. Extra: Registration to PET template.
Since I am worried about that spatial normalization depends only on the CT modality, that doesn’t have enough contrast for visualize the internal structures of the brain unlike MRI modality, I used the 18-FDG (same as our PET) template that comes with the Sigma atlas to run a bsplines registration on the (skull CT) normalized brain-masked PET images. I didn’t get fine results on this step, so I continued with the skull-CT normalize PET images.
7 Standarization
I apply z scale to the images before the SPM.
Question
In order to asses significant patterns produced from a continous variable (like a omic variable) between two groups (Controls vs T2D+Diet) in the marker distribution of the PET FDG brains, I am unsure how to define the contrast and the design matrix. This could be more a question of statistics and how the GLM works. As is my understanment, if I include this continious variables in my design matrix, what I do is use it as a regressor and ‘clean’ the signal in the images according to it. If I choose it in the contrast it will show the voxels that are significant, and therefore the pattern generated, of the comparission between the distributions of each voxel in the image and the total distribution of my variable. What I want to do is, compare my two groups, and the distribution of this continous variable of each group, to obtain the pattern where the distribution of my variable is different between the voxels and groups.
For now my desing matrix is like this;
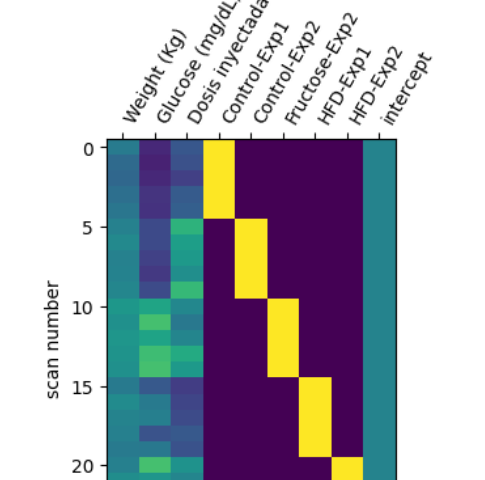
But I want to add new variables I am interested in seeing the effect within the groups. Should I split the (continous) variable like I did with my groups to see the effect (as an intercept of my continous variable with the groups)?
On other hand, I noticed that Nilearn first level GLM model has a compute regressor whereas the second level class doesn’t mention it. I am correct in my assumption that the GLM implementation of nilearn second level does a regression of the variables not selected in the contrast?, does it ‘denoise’ my data according to the continous variables, as in instance in my design matrix: glucouse, weight and injected dose?.
I also work on SPM12 in matlab, however, is not my preference. In SPM12, in the factorial desing specification I can upload a matrix of covariates, that (I think) will apply regression to each in order to clean the signal. How does the noramlization options for this works? it let you choose between either divide the images (proportional scaling) or apply ANCOVA for global nuisance effects.
I hope I can clarify this concepts thanks to your collaboration! ![]() .
.