I have a directed adjacency matrix denoting how each of my brain parcels (not vertices / voxels!) corresponds to any other parcel in the matrix (this matrix contains test statistics, like t or z-scores, etc.). This matrix is accompanied by a second matrix that contains the corresponding p-values.
I wonder how I could threshold the test-statistic matrix in a “good way” by also taking the spatial covariance into account.
The easiest solution would be to apply some sort of multiple comparison correction (e.g. FDR) but that would not take the spatial structure into account and seems to be to conservative. At the same time, I know that there are toolboxes like the NBS-Toolbox (also available in R now apparently), but they seem to:
1.) be tailored to voxel-/vertex wise matrices using Random Field Theory to inform about spatial covariance? As I use parcel-wise data, I am not sure if this can be applied here…
2.) be tailored to undirected matrices, and I am also not sure if those toolboxes can handle asymmetric (= directed) adjacency matrices?
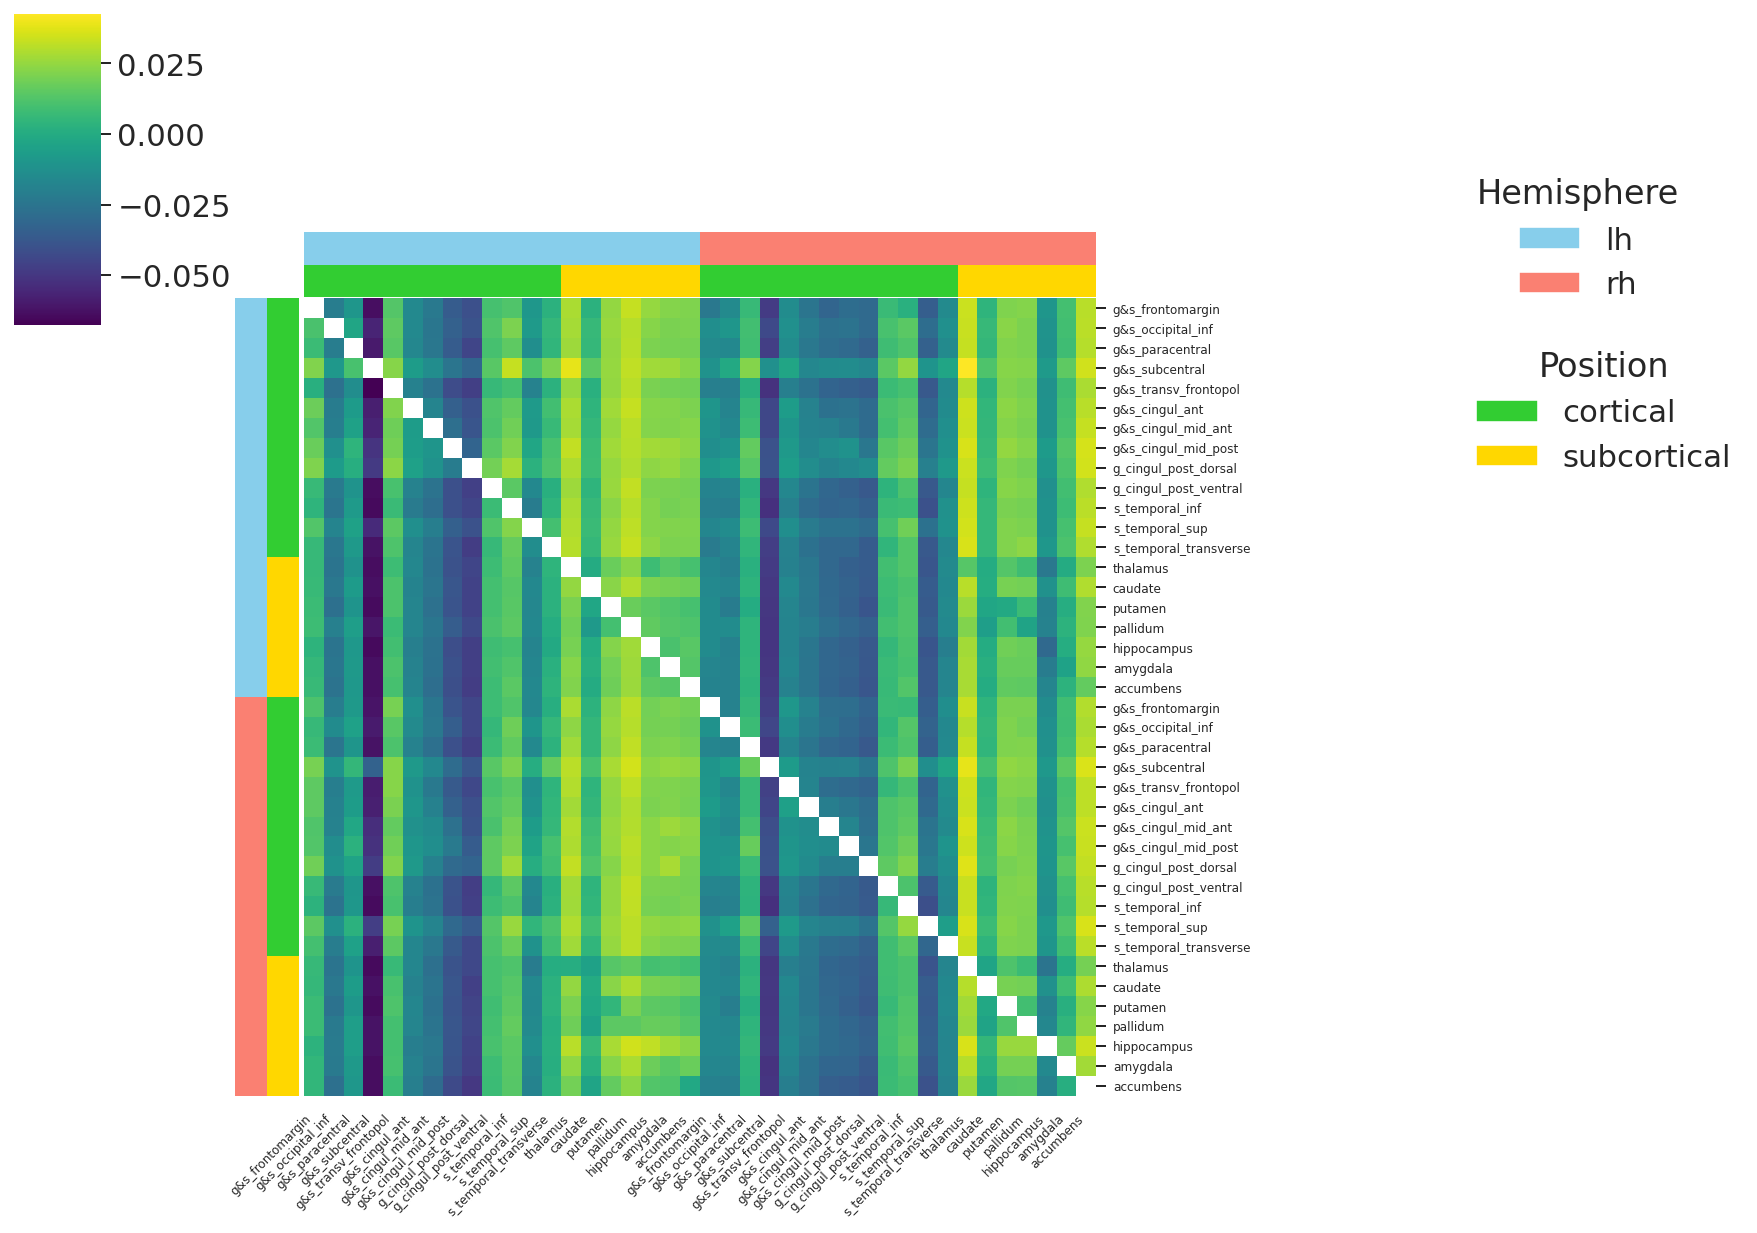
Here’s an illustration of how the stats input matrix could look like:
If you want to have a reliable test that takes into account the dependence between values, you need to use a permutation test, i.e. randomize some key information while preserving the intrinsic data organization.
My 2c,
Bertrand
@bthirion : A colleague had the idea to use mne.stast.permutation_cluster_1sampp_test for this. Although the whole library is meant for MNE data, I don’t see why that wouldn’t work for this problem? In the end, it’s just a matrix with statistical values in it, and you should account for spatial covariance?
Since it’s a directed matrix, the colleague also reminded that MNE-python is meant for symmetric matrices, but maybe you can somehow solve the problem by calculating both diagonal halves independently?
Do you have an opinion on this?
If you use a cluster-level test, you’re changing the kind of inference you’re doing: this is different from inferring what cells in the matrix have a high value.
Besides, it is unclear to me in which direction you want to consider connectivity: rows, columns, both ?
Best,
@bthirion Sorry, for the late reply. I think what I probably would need is to generate n matrices like the one above but where the corresponding inputs are spatially permuted. Then, I would somehow need to follow the logic of the NBS toolbox to threshold the original matrix while taking spatial information into account.
Besides, it is unclear to me in which direction you want to consider connectivity: rows, columns, both ?
As I do not have a clear hypothesis, I would prefer a method which takes both into account, but I think that the NBS toolbox for example expects the matrix to be symmetric.