Dear all,
Currently, I’m using CAT12 to do a voxel-based morphometry for longitudinal data in two groups with two timepoints.
I have processed the data and created a spm.mat file of the basic model. To visualize my results the only thing I need is to define a contrast.
This is where I get lost because for longitudinal data with 2 groups the manual prescribes these contrasts for main effect of group and interaction of time by group:
Main effect Group = [ones(1,k)/k -ones(1,k)/k ones(1,n1)/n1 -ones(1,n2)/n2)]
Interaction Time by Group= [eye(k)-1/k 1/k-eye(k)
where k is amount of timepoints, n1 is amount of subjects in first group and n2 is amount of subjects in the second group.
But how do these formulas lead to a contrast that can be filled in the contrast manager?
(so consistent of 0, 1, -1 with the right length)
Some more background information:
I have two groups that I want to compare. I want to see whether the groups differ in their differences between the timepoints(k=2). The first groups contains 10 subjects, the second group 12 subjects.
The design matrix has the following layout:
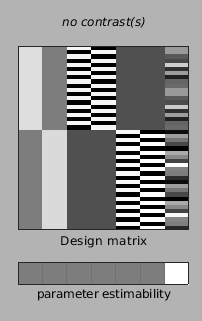
With 7 columns, from left to right this is:
- Group 1
- Group 2
- Group 1 timepoint 1
- Group 1 timepoint 2
- Group 2 timepoint 1
- Group 2 timepoint 2
- Global
Hopefully someone has encountered this problem before and is willing to help me out.