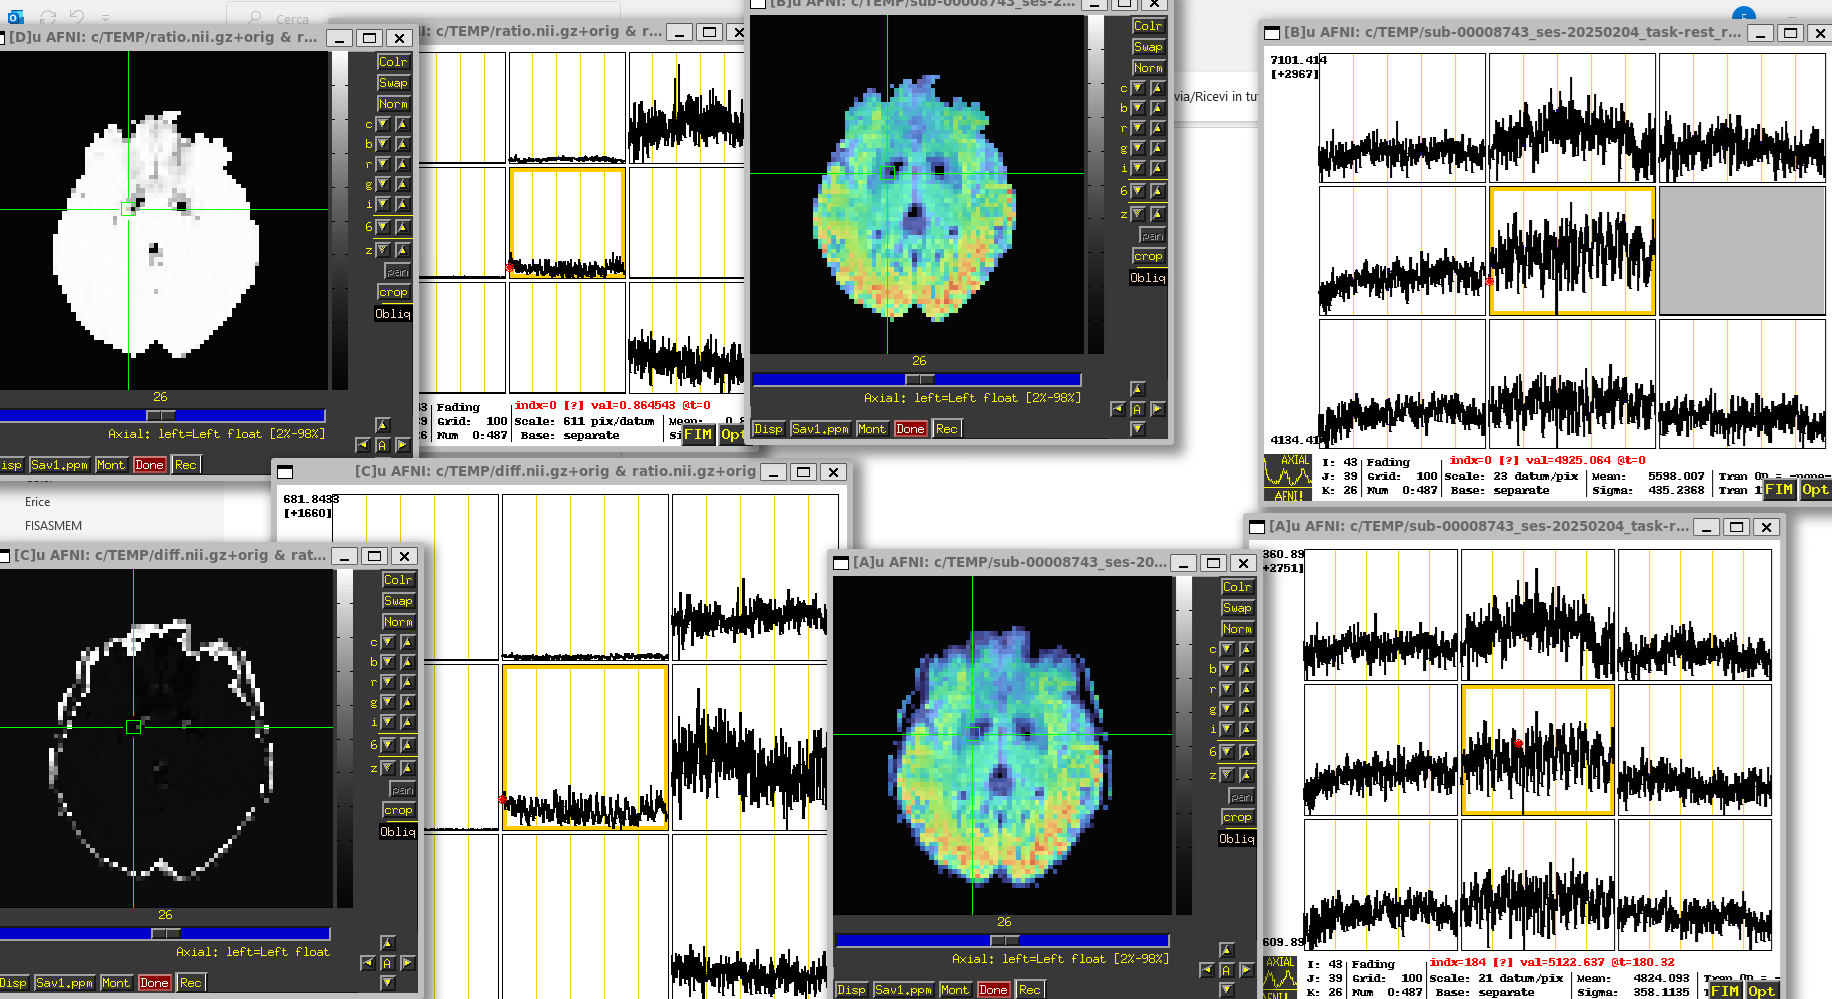
Hello, we are using both fmriprep amd tedana in out lab. I noticed that the _desc-preproc_bold output by fmriprep and the _desc-optcom_bold output by tedana, both, supposedly containing tedana optimally combined echoes, are not equal, especially where SNR is low. See attachemnt: top right tedana, bottom right fmriprep, top left ratio, bottom left difference.
Admittedly, the tSNR is almost identical (overlay on the right), but series are not, also in good SNR areas.
Is there any explanation for that (ie different steps etc) ?
Best reagrds and thank you in advance, federico
Hi @Federico_G,
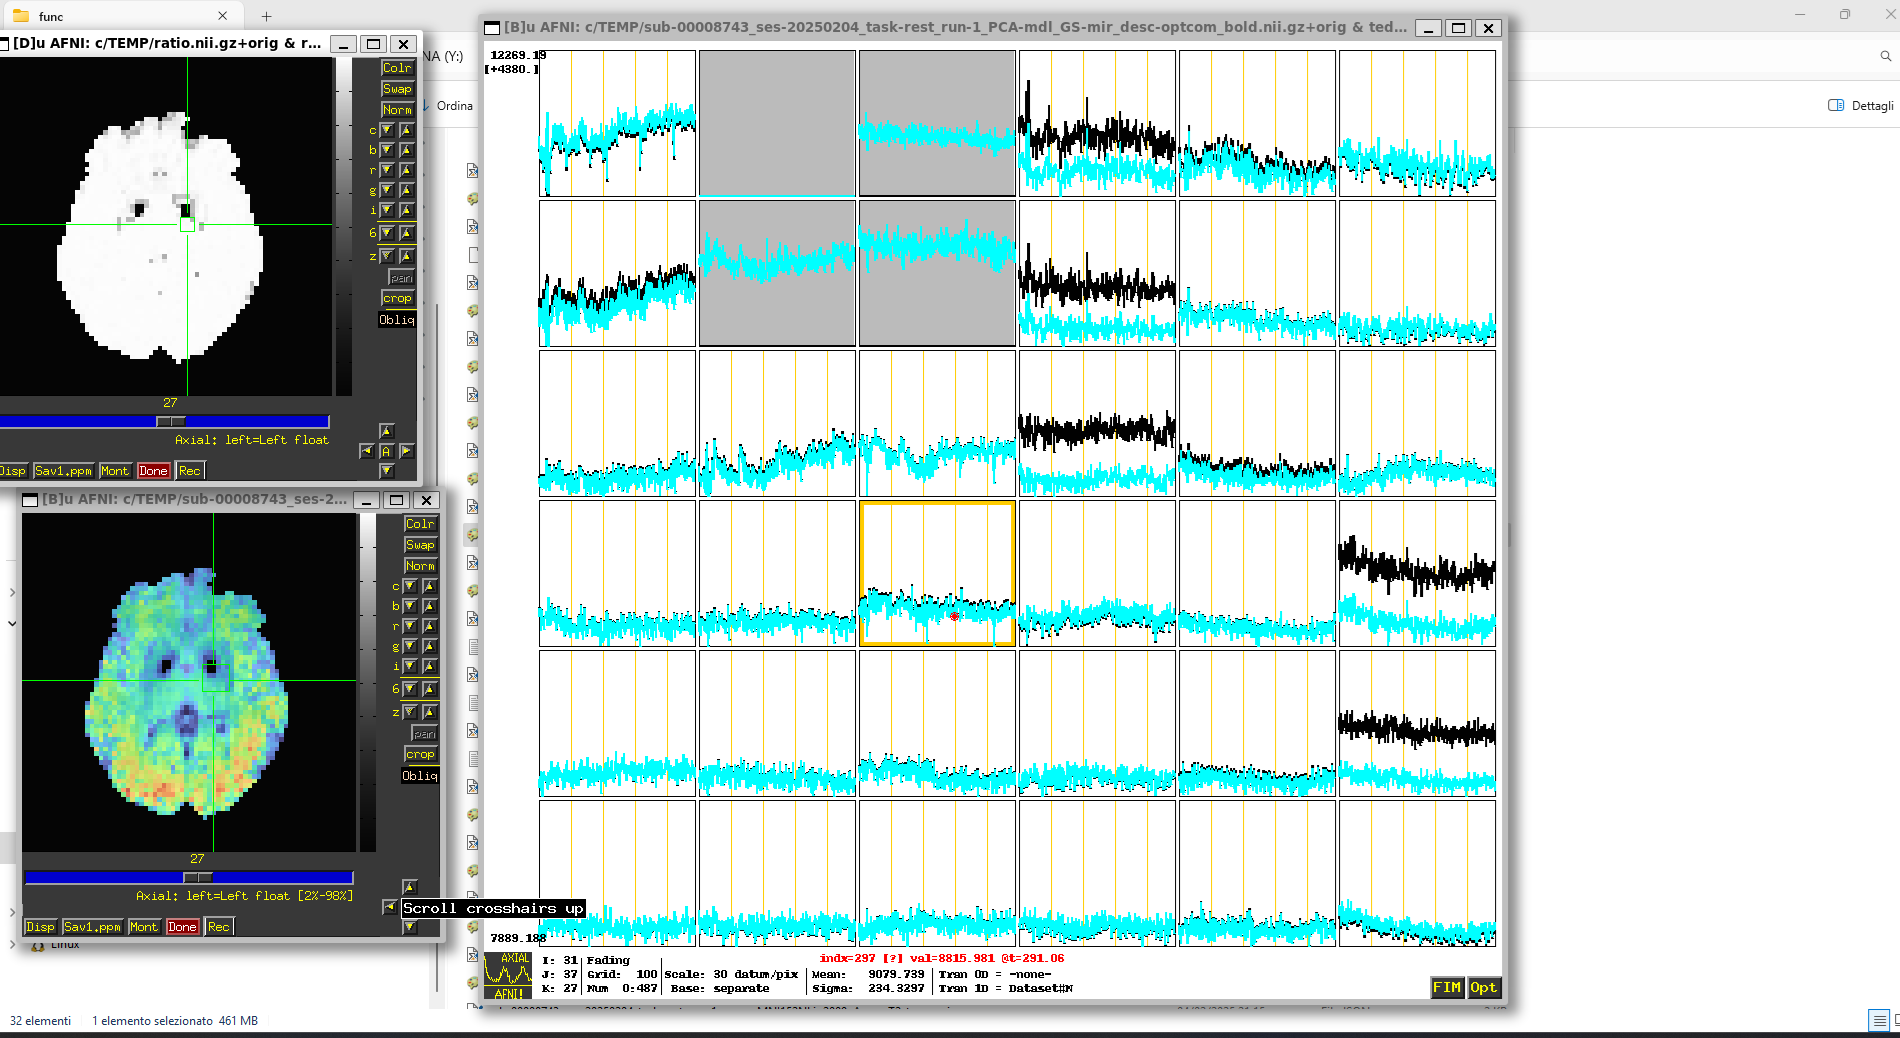
In our data, we also observed some differences if we used the same echoes as input to tedana. However, these differences were minor and we considered them as related to numerical precision. For instance, it is possible that the voxelwise estimates of the weights for the T2*-weighted combination are slightly different between TEDANA abd fMRIprep. Yet, as I said they were minor for our data. Considering that you are using AFNI to present the results, would you mind plotting the timecourses on top of each other using the Dataset [N] option in AFNI with different colors? Such a plot would allows us to see the degree of these differences.
Thanks very much
So it seems that the estimates are actually very similar for the majority of voxels, corroborating our observations. Even in those voxels where the timeseries have different mean, the trend of the fluctuations seem very similar. What if you did a simple detrending, Opt → Detrend → 0 or 1?
To me, mean differences are probably related to minor differentes in the weights for echo combination.
I just noticed this thread. I’m not fully sure what fMRIPrep does differently, but, given you’re looking at areas near dropout regions, this looks like an issue with masking. tedana creates an adaptive mask with only “good” echoes (More detail here: tedana’s denoising approach — tedana 24.0.2 documentation ). Our thresholding is fairly conservative, but it will remove voxels with relatively very low signal compared to other voxels in the user-provided mask. If a voxel is in your initial mask, but is “bad” in all echoes in the adaptive mask, then it will be all 0s. If there’s at least one good echo, the optimal combination will use only the good echoes.
I suspect the optimally combined data that’s calculated within fMRIPrep might not use an adapative mask & would see differences that are similar to the ones you’re showing above.
Dan
Thank you for your comments. The issue is actually a minor one.