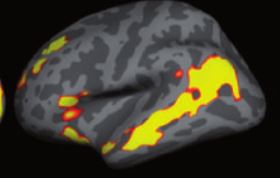
I’m aiming to display group activation results (volumetric T-map in MNI space) from SPM on a surface, which will be used as the overlay. I would like to achieve the display similar to the ones shown in the figures:
Could you please advise which file I should use as the underlay in Surf Ice?
I’ve noticed various files in Surf-Ice folders like atlas, BrainNet, caret, fs, or mni2fs, and I’m wondering whether these files correspond to volumes in MNI space or Talairach space.
You will want to choose a visualization method that matches your statistical analysis.
Voxel-based statistics. Most SPM analyses are computed per voxel. In this case, MRIcroGL is a nice voxel-based visualizaiton tool. Below is the image you get if you run the Scripting/Templates/mosaic2 demonstration script:
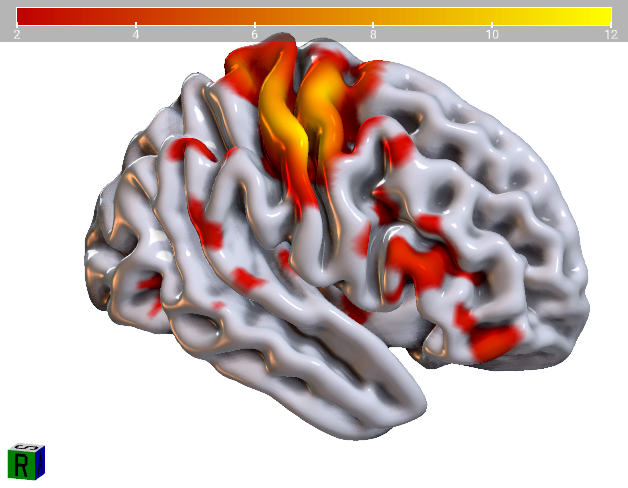
Vertex-based statistics. SPM data can be mapped onto surface meshes. This is useful for cortical signals, and the meshes can be inflated allowing one to see inside the gyri. CAT12 does this, and you can also convert mesh data for analysis with PALM. Surfice can visualize these nicely. The results from these tools will be GIfTI files with per-voxel statistical values. Below is the Scripting/Templates/basic_paint_surface.
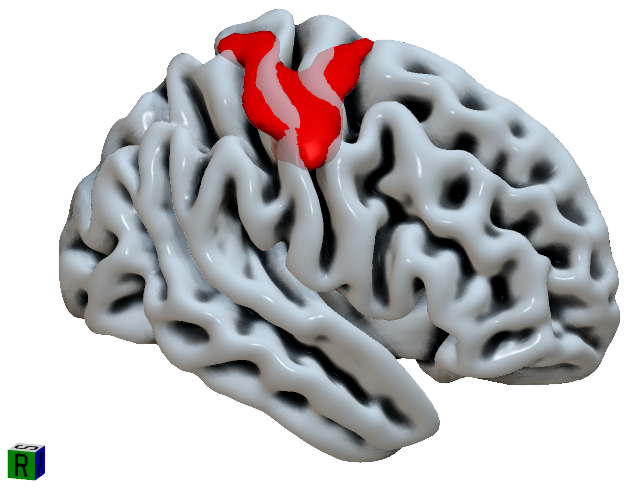
If you have voxel-based data and a fixed statistical threshold (e.g. z = 5.2) you can convert your voxel-based NIfTI image to a mesh-iso surface. You need to be very careful about choosing a background mesh that roughly matches the shape of your NIfTI image (e.g. inflation deforms surface, many surface meshes do not match MNI space). Below is the Scripting/Templates/fmri_mesh
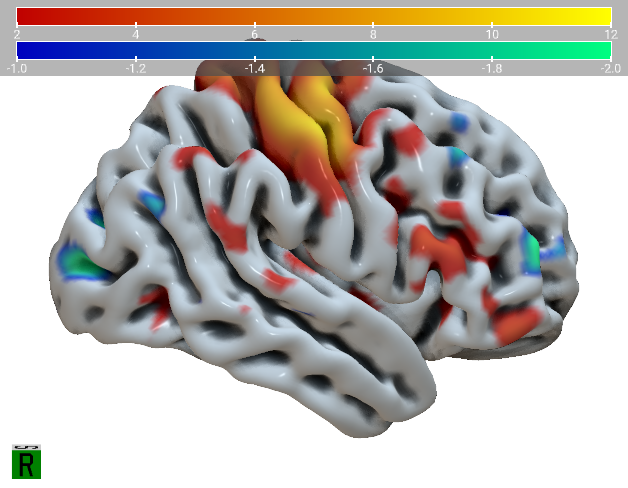
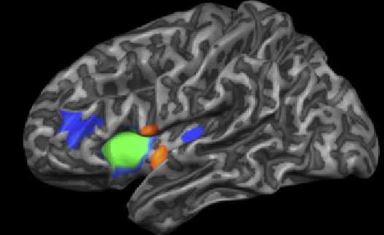
If you have voxel-based data, you can also project it onto a mesh. This is the most perilous option, as a strong assumption is made that the location of the voxels matches the location of the vertices, which is certainly not true for heavily inflated meshes. Below is the example from Scripting/Templates/matcapPainted
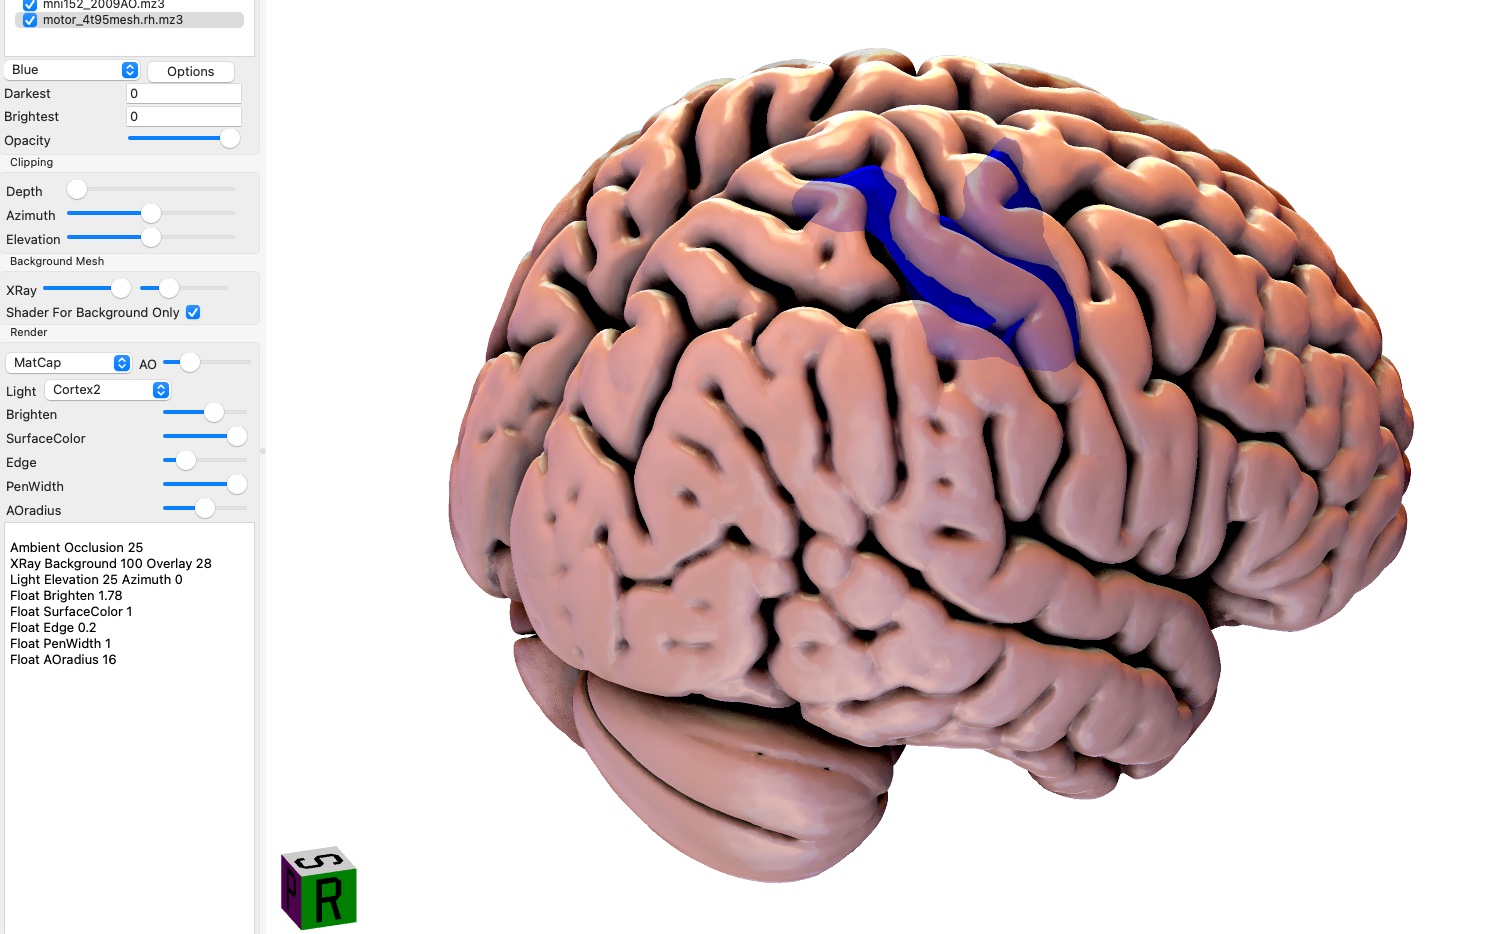
If I’m not strictly reporting activation results but just creating a demonstration, such as illustrating manually drawn ROI positions or theoretically locating a brain region, projecting them onto a mesh seems like a good choice.
All of my hand-drawn ROIs are drawn on images that have been spatially normalized to the MNI template in SPM by default.
In Surf Ice, are there existing mesh files that correspond to SPM’s default template, allowing me to quickly demonstrate the positions of these ROIs on the mesh?
(This is a visualization generated by SUMA, which maps volumetric group activation onto a surface.)
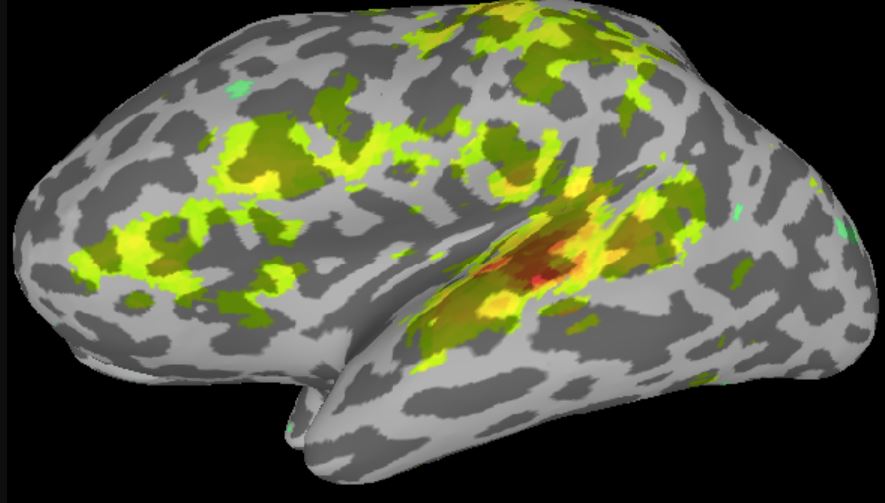
Or at least like this:
The authors of SUMA created inflated surfaces for the default group template (in Talairach space) in AFNI using FreeSurfer. This allows for a direct correspondence between locations on the default group template in AFNI and these inflated surfaces, facilitating the mapping of volumetric activation onto them. However, SUMA seems to lack a similar correspondence for an MNI template.
Do you know of any other software that can perform similar functions to SUMA for mapping SPM templates?
I guess I do not understand the question. I believe that Surfice supports all the mesh formats that SUMA does (and many more). Therefore, you should be able to load the same meshes and volumes as SUMA. For voxel formats, if your data is in AFNI head/brik format you can convert it to NIfTI with 3dAFNItoNIFTI