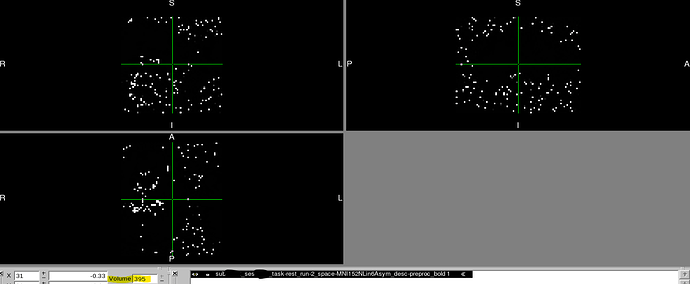
Distortion introduced partway through time course after transforming into MNI space with fmriprep

Summary of what happened:

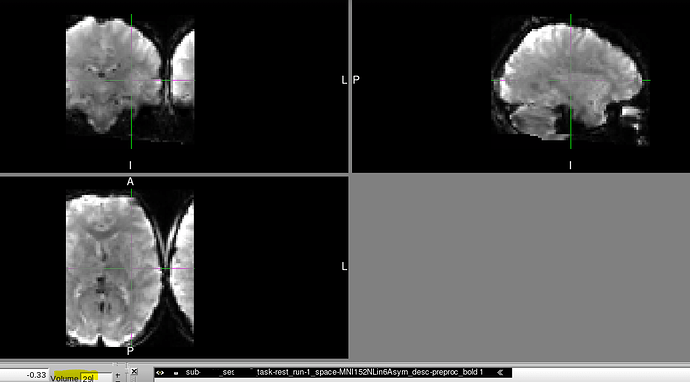
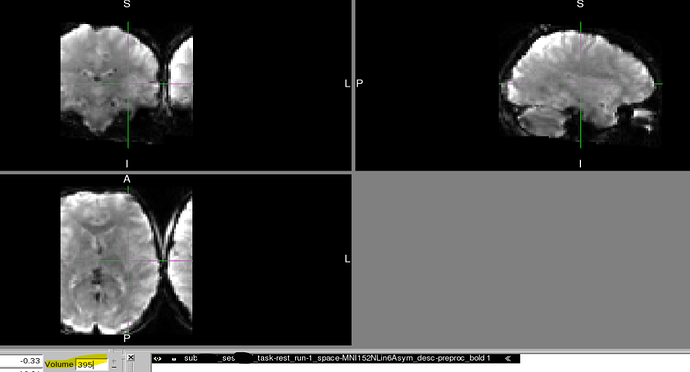
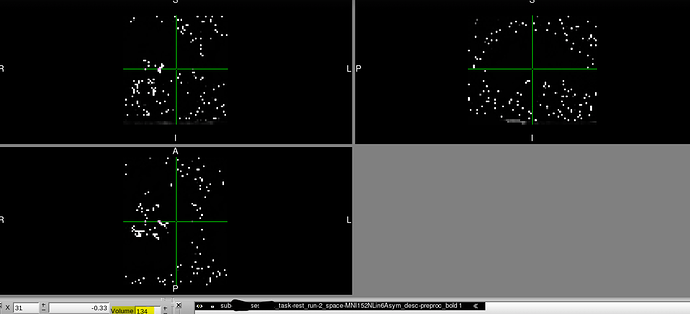
After transforming our T2* functional data into MNI152NLin6Asym space using fmriprep 23.2.1, our images became distorted, but this distortion only manifests midway through the time course. Such distortion did not exist at preceding preprocessing steps, such as normalization to the subject level T1w or within the raw data.

Command used (and if a helper script was used, a link to the helper script or the command generated):

singularity run --cleanenv -B /${TMPROOT}:/${TMPROOT} ${FMRIPREP}                \
	    ${BIDS_DIR} ${OUTPUT_DIR} participant                                        \
	    --fs-license-file=${FS_LICENSE}                                              \
	    --participant-label=${SUB}                                               	   \
	    -w ${WORK_DIR}                                                               \
	    --cifti-output                                                               \
	    --output-spaces anat fsaverage MNI152NLin6Asym	                             \
	    --ignore slicetiming                                                         \
	    --return-all-components

Version:

23.2.1

Environment (Docker, Singularity / Apptainer, custom installation):

Singularity

Data formatted according to a validatable standard? Please provide the output of the validator:

"We found 4 Warnings in your dataset."
(Warnings are known to team and are expected. Ex, missing sessions due to withdrawals.)

Relevant log outputs (up to 20 lines):

N/A

Screenshots / relevant information:


We recently discovered that at least two of our T2* functional scans became distorted only when transforming to MNI space (MNI152NLin6Asym) and only partway through their time course.

Basically:

  1. Raw data shows no similar distortion throughout its full time course.
  2. Data normalized to the subject level T1w shows no similar distortion throughout its full time course.
  3. fMRIprep HTML QC report shows no similar distortion in any of its visualizations.
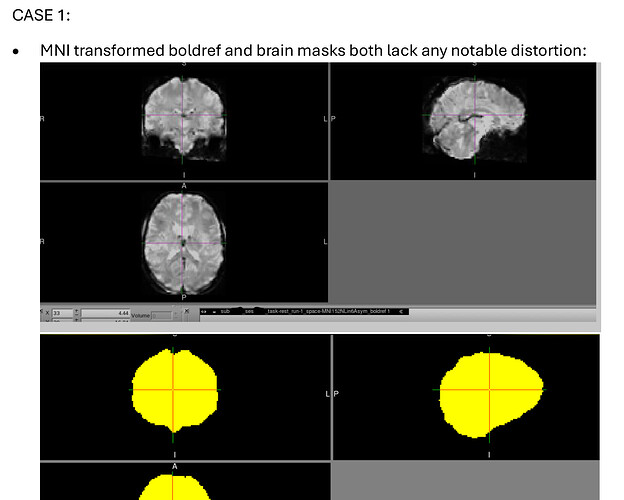
  4. fMRIprep’s MNI transformed boldref shows no similar distortion.
  5. fMRIprep’s MNI transformed brain mask shows no similar distortion.
  6. Beginning of MNI transformed time course shows no similar distortion.

However, partway through the time course after transforming to MNI space, the image is distorted in dramatic and perplexing ways. It should also be noted that:

  1. Once the image becomes distorted, it remains this way for the rest of the sequence.
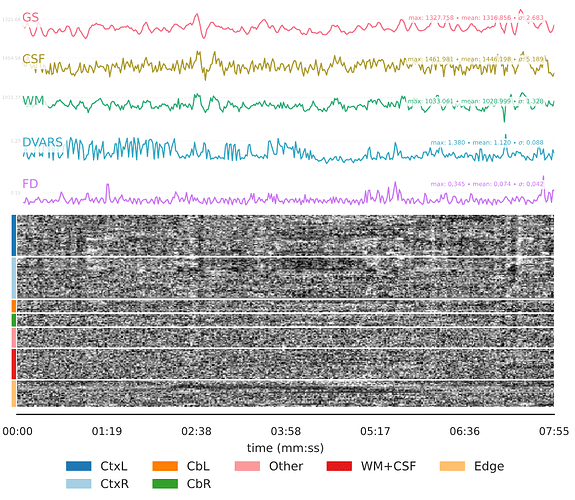
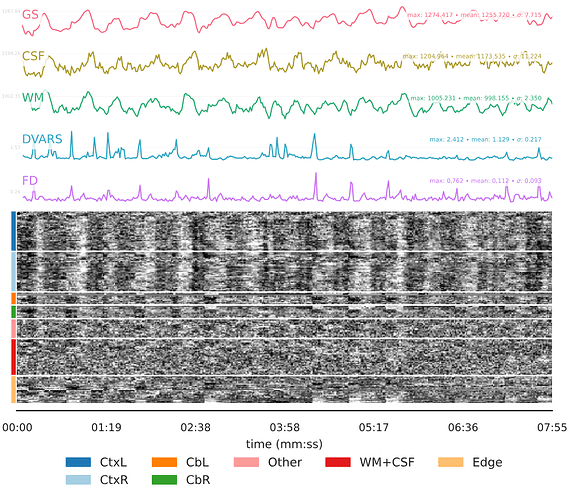
  2. There was no movement or other unusual event around the time when the sequence became distorted, as evidenced by all preceding steps appearing unaffected. Overall movement was also low in both cases with a mean FD of 0.112 for CASE 1 and 0.074 for CASE 2.
  3. Both individuals had a second run of the exact same sequence collected on the same day, and there were no such issues in that alternate run. Both individuals also collected another time point using the same sequences and there were no such issues, so it seems unlikely that these are subject-level phenomena.

These two examples were discovered inadvertently when running FEAT, so we are concerned that other scans could have been impacted by similar errors without us knowing, as we encountered no issues when running fmriprep itself. If anyone has any insight as to why this could be happening, we’d be very grateful.

Below, you can find screenshots of the two cases. Apologies also for the long image. New users are not permitted to embed multiple screenshots.
Could you share the derivative directory for an affected subject?

Does this happen consistently and for the latest version?

Thanks for reaching out! Unfortunately, I just verified that I do not have permission to share this full directory, as it was collected as part of a clinical trial. I only have permission to share 2D screenshots. Are there any specific things that I should check for myself within the derivative directories?

Also, when you ask if this issue happens consistently, are you asking whether this issue exists if I rerun these people in 23.2.1? If so, I am not sure yet, but in case this was what you were asking, I’ve started rerunning them now. To be honest, I’d not realized that doing so may make a difference, but if it does, that may tell us something. My colleague is likewise rerunning this data with an even older version of fmriprep on a different server, so I will report back on what she finds.

In the meantime, I can update to say that this issue does not exist for these two cases when rerunning in the latest version (24.1.1). This is certainly valuable information, but even so, our lack of insight into why this is happening leaves us concerned that a similar issue may still occur, albeit within different scans, considering how seemingly “randomly” these two cases appeared to be impacted.

Do you perhaps have a hypothesis as to why this issue might have existed in 23.2.1 but not in 24.1.1? When reading the patch notes between the two versions, I did not see anything that would immediately indicate a relevant fix to me, but it is possible I am not understanding the impact of some of the updates. Thanks!

I have a couple thoughts that could be explored, but no real hypotheses. The only things that change volume-to-volume when resampling are the head-motion transforms and the target data array.

If the head motion transforms changed significantly, that should appear in the FMRI summary image as a large spike in framewise displacement. If there were a memory error and a data array were passed to the resampler at an offset that doesn’t correspond to a volume start, then you could get the kind of tiling you’re seeing. It’s not at all clear how to debug that, if it doesn’t show up reliably.

Honestly, we are very grateful for any thoughts, so thank you! As to your two ideas, unfortunately, there did not appear to be an especially notable or different spike in the carpet plots, at least to my eye?

CASE 1:

CASE 2:

As for your second theory about the memory error, that is certainly intriguing as a possibility, but I’m also a bit surprised that this would not have crashed the processing. I don’t know what’s going on under the hood, so does this mean the pipeline would not recognize that a memory error is occurring at the time? What might cause such a memory error? If it is a systems limitation, I should mention that I was processing on this system alone, so I would have been shocked if it were overloaded, but you’re right that there’s no real way to know that.

Also, you mention how that the memory issue could cause tiling, so I am curious if you would classify both CASE 1 and CASE 2 as tiling? I ask because I am not familiar with this term and because, to me, they looked so qualitatively different in their distortion. Honestly, it might be something of a positive if both are due to a common root, but I was not certain if I could make that assumption previously.

As important update: this issue no longer exists in these two cases after rerunning in 23.2.1 (the version that originally produced the above distortions). Does this impact your ideas at all regarding what could be going on? In some ways, I find this a bit more troublesome, as it suggests to me that this is not a data-specific or version-specific problem but rather, a more random issue. In turn, I fear this may make it difficult to predict? Do you have any thoughts on how to best anticipate this and/or to mitigate the risks of this happening? Thanks!

If it doesn’t raise an exception, then no. The kind of error I’m thinking of would be a miscalculation of offsets. e.g., If you had a memory block and wanted to fill it with volumes A, B and C, good offsets could produce something like AAAABBBBCCCC, while an offset error might produce AAAA00BBBBCC, so when looking at the second and third resulting volume, you’d see 00BB and BBCC.

I agree that a random error is going to be hard to catch and prevent from happening. If you look in your scratch directory, you should be able to find a config.toml file that includes a section like:

[seeds]
master = 24403
ants = 36213
numpy = 33127 

You could see if rerunning 23.2.1 with --random-seed 24403 (using the actual master seed you find) gives you the same result. I’m skeptical, because there really shouldn’t be any randomness in the processes that appear to have gone wrong.

I think probably the best way to catch this would be to construct carpet plots of the final results in all target spaces. We can look into doing this on the fMRIPrep end in the future, and there are standalone tools (like GitHub - sidchop/carpetplotR: Fast and easy visualization of fMRI data quality using carpet plots.) you can use to review your results.

I see, thanks! That offers a lot of clarification. However, I wonder if there is a reason why these offset errors produce such qualitatively different results? Is something different going on in each situation? CASE 1 seems almost like the whole brain was offset and then wrapped around, whereas CASE 2 is very dispersed.

Also, for CASE 1, the split remains consistent throughout the duration of the scan (ie, vols 29-395 are all “wrong” in the same way)…


…versus CASE 2, which is highly variable, with each vol presenting a slightly different “speckled” pattern. It’s a bit hard to detect via screenshot, but you may notice the bright voxels are not in the same place. Likewise, even though this is just two examples from the middle and the end of the run, each individual volume had a slightly different pattern from the previous/subsequent volume.


Does this mean that, for example, in CASE 1, the data was offset 1x and then stayed offset the same way for the rest of the run, whereas CASE 2 was offset differently for each volume? If so, why might this be? I appreciate your patience, as I am just trying to wrap my mind around this a bit more.

Unfortunately, we do not have the scratch data for these cases who had errors, anymore, as that is typically cleaned up after running “successfully” (ie, no exceptions raised). That being said, now that I know this is a possibility, I can be on the lookout for that file to try and archive it should this happen again. I will note, though, that we are near the end of data collection, and we’ve been preprocessing and QCing in real time, so I do not know if there will be many new opportunities to catch this live.

Thank you very much for this resource! This is very helpful! As of now, we were planning to calculate and compare DVARS from the T1w space data to the MNI space data to see if there were any notable changes. Does this seem reasonable, given your knowledge of where and how this problem happens, or is there additional nuance and capture ability to this more qualitative QC?

For example, is it possible that the same issue could exist in both T1w and MNI space, so we’d be unable to detect a change between them? In my two cases, the error emerged in MNI space, but given the type of error you are describing, is it fair to say it could technically occur at any point during the preprocessing?

Yes, I do feel it would be helpful to add these into the fMRIPrep HTML outputs, if possible. I would have definitely checked them as part of my visual QC workflow, had they been present.

My concern with this issue is that–at least based on conversations with colleagues who I approached for prior insight–it is not a very common QC step to routinely check the full time course after the MNI transform. We do check it in its entirety early in our QC pipeline, but it is not repeated at this point, as any scans would have already been flagged for any notable time-based scan- or subject-level artifact. We had not anticipated the possibility of a more random technical issue midway through. As such, I fear such issues may be easier to miss, especially if they of are a less severe degree than those presented here (ex, the distortion only exists for the last 10 vols). Fortunately, these two cases crashed FEAT, but we do not yet know if more “minor” cases slipped through. I will also note that they did not throw any errors when being smoothed or denoised in conn toolbox, but we paused further analysis once this issue was identified, so it is still possible it would have crashed eventually.

Thank you very much again for your insight! Given everything you’ve seen thus far, I am curious how confident you now are that this is due to the memory issue vs some other random error? Also, assuming you are somewhat confident, I was wondering if you know: (1) why this may happen, (2) if there is anything we can do to prevent it (vs simply detect it afterward), and (3) how common this is? We are very grateful that you were aware of this possibility, but no one I spoke to personally had seen this prior, so I don’t know if this is rare or simply undetected.