A basic question: does the polarity of a bvec matter ? In other words, if a gradient direction in the bvec file is rotated by 180 degrees, would it matter ?
Hi,
here is what FSL-eddy says about it:
The diffusion signal is modelled using a Gaussian Process, which means that it makes very few assumptions about the diffusion signal (unlike parametric models such as for example the diffusion tensor). The only two assumptions are
- the signal from two acquisitions acquired with diffusion weighting along two vectors with a small angle between them is more similar than for two acquisitions with a large angle between them
- the signal from two acquisitions along vectors v and -v is identical.
From these two assumptions it also follows that:
- if v1 and v2 are two vectors with a “small” angle between them so that it can be assumed that the signal from the corresponding acquisitions is “similar” then v1 and -v2 are equally similar.
Because of the way the diffusion signal is modelled, and because eddy needs to be able to distinguish between signal variation caused by diffusion and that caused by eddy currents/movements it is beneficial if the data is acquired with either
- A set of diffusion encoding directions that span the entire sphere and not just a half-sphere
- A blip-up-blip-down (phase encode reversed) acquisition
or with both. Note that “sampling on the whole sphere” does not imply twice as many directions. From a diffusion perspective sampling along v and -v is exactly equivalent whereas from the perspective of eddy current distortions they are different. One can therefore have two sampling schemes that both sample the diffusion evenly and equally well (and with the same total acquisition time), but where one is on the half sphere and the other on the whole sphere. To make this concrete look at the two sampling schemes below. In these plots the end of each vector is marked with an x-marker. They sample the diffusion in exactly the same way but the one on the left facilitates correcting for eddy currents while the one on the right does not. Note also that either of these schemes can easily be created from the other. To for example transform the half sphere scheme to the whole sphere scheme one just need to replace half the vectors by their negations.
That is very helpful @jsein . I have a dataset where I have 4D DWI images and bvec/bvals for all subjects that were produced by an “unknown” pipeline. I also have a handful of cases for which I have dicom data. I noticed that for those cases, when I compare the vectors that dcm2niix produces from dicom with those that came with the nifti, some of them are essentially the same vector (maybe a 1 degree separating them), and others are negated (180 degress difference). Output of dtifit look exactly the same using either bvec file, as would be expected. However, it sounds like the apparent discrepancy of polarity for some gradient vectors would be problematic for eddy ? In other words, for proper correction, I would need to know which one of the vector sets is correct ? The problem, of course, is that unless there is a pattern we can establish as to which volumes had their gradient directions reversed, we have no way to of knowing the “correct” polarity for the acquisitions for the vast majority of the dataset where we have only nifti data.
Interesting thoughts and difficult problem that you are facing!
Indeed if only one part of the bvecs have their polarity reversed, I think you are in trouble with eddy because there will be a mismatch between eddy’s prediction of the off-resonance field due to the eddy currents produced by that particular diffusion gradient and the actual data. Since for some subjects you also have the DICOM, I would encourage you to try to correct both data set (the one converted by an unknown pipeline and the one converted by dcm2niix) with eddy and check what is the output, to see if eddy manage to find its way anyway to correct eddy current in the datasets with wrong bvecs.
All the details on how eddy works here:
https://doi.org/10.1016/j.neuroimage.2015.10.019
I think @jsein did an elegant job describing the issue. Since you have the DICOM data, you might want to try these tests:
- See if eddy does a better job with the dcm2niix conversion than the unknown pipeline.
- See if the unknown pipeline is saving data as a half sphere. This is easy to visualize. With the exception of Eddy, most tools do not care about the polarity of the vector, so perhaps the unknown tool is simply saving data as a half-sphere (which should work with all tools but Eddy). As an aside, Siemens default gradient tables are always half-sphere, the rationale is that this minimizes the difference in Eddy effects in the diffusion data. Due to this, it is often beneficial to use custom gradient tables for Siemens scanners if you want a simple Eddy acquisition.
- Have you tried converting your DICOM data with tools other than dcm2niix to see if it replicates the unknown pipeline? For example, I think that MRTrix mrconvert, dicm2nii and dcm2nii (the predecessor to dcm2niix, which you can get with old versions of MRIcron) would all generate bvec files. While the symptoms are not a perfect match, I wonder if the unknown pipeline is based on an old version of MRTrix mrconvert, as also described here. Specifically, some FSL tools make strong assumptions of the image data being a negative determinant, which can impact the bvec files as described here and here. Since the BIDS specification defines the bvec files as being in FSL-format, dcm2niix attempts to generate this very unintuitive form of data.
- There is an arduous method to determine the correct solution using visual inspection. You display the NIfTI volumes in multiplayer-view (simultaneous sagittal, coronal and axial) and plot the reported bvec for that volume. You can then compare volumes with opposite vector polarities to visualize the Eddy impact. This method is eased with custom gradient tables and sequences with strong eddy effects (each monopolar sequences). I used this method to validate the dcm2niix solution for our sequences. However, I have only done this with Siemens data, and perhaps it would be useful to have someone validate the solutions for other manufacturers.
2 Likes
Thanks you @Chris_Rorden for taking the time for laying out the suggestions in detail. I am in the process of trying eddy on both the data generated by unknown converter/pipeline and dcm2niix (suggestion 1).
Suggestion 2. It seems actually the dcm2niix output, which matches dcm2nii output, is the one that is half-sphere (almost, not quite), whereas the unknown converter bvecs seem to nice full sphere coverage. Note: this is a Siemens system.
Suggestion 3. As mentioned above, dicom2nii produces same output as dcm2niix. Mrtrix3 mrconvert from 2018 produces bvecs whose coverage in unit sphere is equivalent, except the vectors are -x, -y, z given the dcm2niix vectors are x, y, z.
Suggestion 4. Haven’t gotten to it yet.
EDIT: I tried dcm2nii, not dicom2nii in the “Suggestion 3” line above. Mentioning this so future readers are not confused.
Since FSL b-vectors are in image space, I suspect the difference between dcm2niix/dicm2nii and MRtrix is that the former stores the data as LAS, while the latter is storing the data as RPS. You could check this by running fslhd on the output of each pipeline:
fslhd dcm2niix.nii
...
sform_xorient	Right-to-Left
sform_yorient	Posterior-to-Anterior
sform_zorient	Inferior-to-Superior
By default, dcm2niix and dicm2nii flip the order of rows when converter DICOM to NIfTI (as DICOM images assume the first row on disk is the top row on the screen with subsequent rows descending down the screen the way we read English; on the other hand, NIfTI assumes the first row on disk is at the bottom of the screen with higher values ascending vertically the way we draw a Cartesian graph).
Assuming you have Matlab and dicm2nii, you can view the raw DICOM vectors using the following script (you will need to change the DTI_sag to match your protocol name):
m = load('dcmHeaders.mat')
bvecs = m.h.DTI_sag.bvec_original';
figure('position',[100 100 500 500]);
plot3(bvecs(1,:),bvecs(2,:),bvecs(3,:),'*r');
axis([-1 1 -1 1 -1 1]);
axis vis3d;
rotate3d
This will plot the original b-vectors as stored in your DICOM images. As your data was acquired on a Siemens system, it should be half-sphere unless the user has a research license and inserted a custom gradient table onto their scanner. A half sphere will look like this.
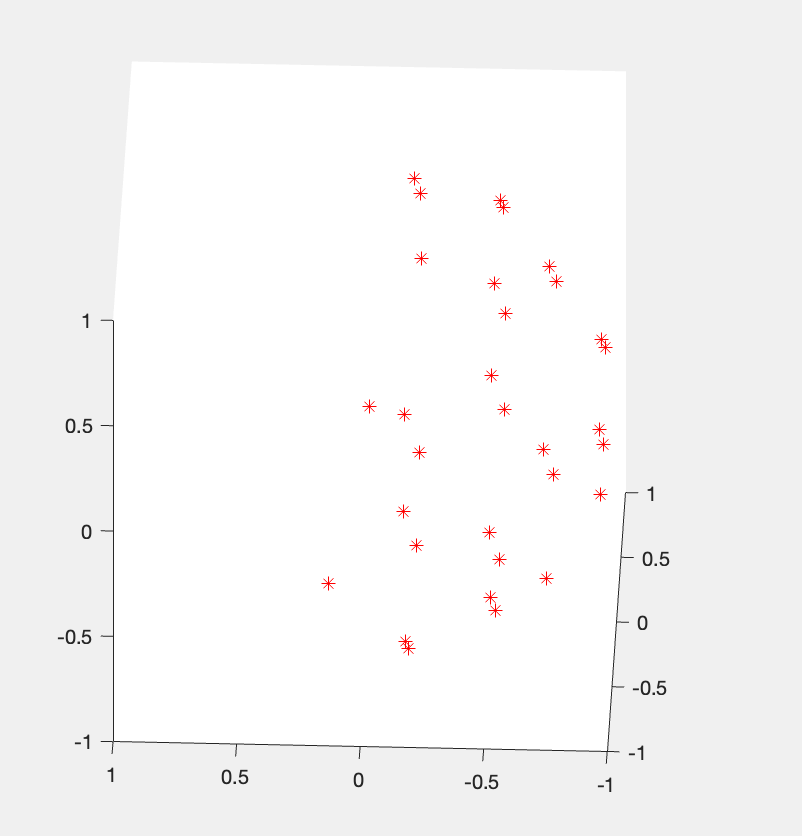
If your raw data was half-sphere and the unknown pipeline shows a full sphere, you know it is doing something wrong. Just be aware that Siemens original raw b-vectors are reported in DICOM scanner space, while the FSL bvec values are in image space, so there is typically a rotation applied. However, a half sphere will remain a half sphere, just rotated.
By the way, the plot I show here is the Siemens (11mb) dataset from here. Similar to what you report, the Siemens default gradient table is almost, but not quite half-sphere. I like to create optimal directions as I describe here. For those interested, I collate advice from others and describe how to objectively compare DWI sequences here.
1 Like
Coming back to this after some more observations from the data @Chris_Rorden , and thanks for your help so far! Still trying to reverse engineer what happened to the bvecs. Following your last response, it appears that the original bvecs as given by dicm2nii are also ~half sphere. One thing I noticed is that the original bvecs as given by h.bvec_original across the three datasets for which we have dicom data are not the same. Nor are the h.bvec . Is this to be expected because whether in scanner coordinate space (original bvec) or image space (FSL bvec), the actual vectors written out are a function of the physical head positioning in the scanner bore ?
A separate observation I made is this: when I wrote in my second message that “some of them are essentially the same vector (maybe a 1 degree separating them), and others are negated (180 degress difference)”, I am wondering whether the 1-2 degrees of differences between the dcm2niix output and the “unknown” bvecs we have are a result of motion-correction and rotated bvecs.
The FSL bvec format is described here and here . It is in image space, and so the identical sequence will generate different bvec values unless the angulation of the images is identical. In other words, if two people are scanned, and the orientation of the slices is adjusted independently for each person, one should expect different bvec values. In contrast, most scanner manufacturers describe gradients in the frame of reference to the scanner bore (though not GE).
A difference of only a degree or so may not matter, and might reflect rounding errors when trying to normalize vector lengths. If some but not all values are negated one expects similar tensors, but this data may disrupt the operation of Eddy.
As an aside, if your data used a bipolar scheme, there will be much less profound Eddy current effects. Siemens product scans use bipolar (twice refocused) schemes by default: they reduce spatial distortion but the longer TE reduces SNR. The idea of Eddy is you can have your cake and eat it to: it can compensate for the artifacts that plague monopolar sequences, while retaining the high SNR of these sequences. If you have a bipolar sequence, the impact of Eddy may be pretty modest (other than outlier replacement).
Thanks again @Chris_Rorden . Understand that FSL bvecs are expected to be different if orientation of slices is adjusted for each person. However, given as you said that the Siemens scanner describes gradients in the frame of reference to the scanner bore, are the original bvecs also expected to be different (as read by m.h.DTI_sequencename.bvec_original) ?
We ran both input datasets (1. dcm2niix output with its bvec and 2. what we got as nifti + slightly rotated/negated bvecs) through eddy and dtifit. The prinicipal eigenvectors are visually very similar, and scalars like FA maps are almost the same. I haven’t gone volume-by-volume comparing eddy output yet.
Regarding the point you make about bipolar scheme, how would you know if it indeed was such, from the dicom header ?
The FSL bvec format is always in the frame of reference to the slice. Therefore, these values change when tools like FSL motion correct the data, e.g. as volumes are resliced to match a different alignment, their bvec directions must change to compensate for the rotations applied by the realignment.
If you are using a modern version of dcm2niix, and your data comes from a V* generation Siemens scanner (e.g. VE11), the diffusion scheme will be reported in the BIDS JSON sidecar. For example, consider this diffusion dataset where series 5 reports
"DiffusionScheme": "Bipolar",
and series 3 reports
"DiffusionScheme": "Monopolar",
Unfortunately, this information is not available for other manufacturers (I believe that Philips uses monopolar by default).
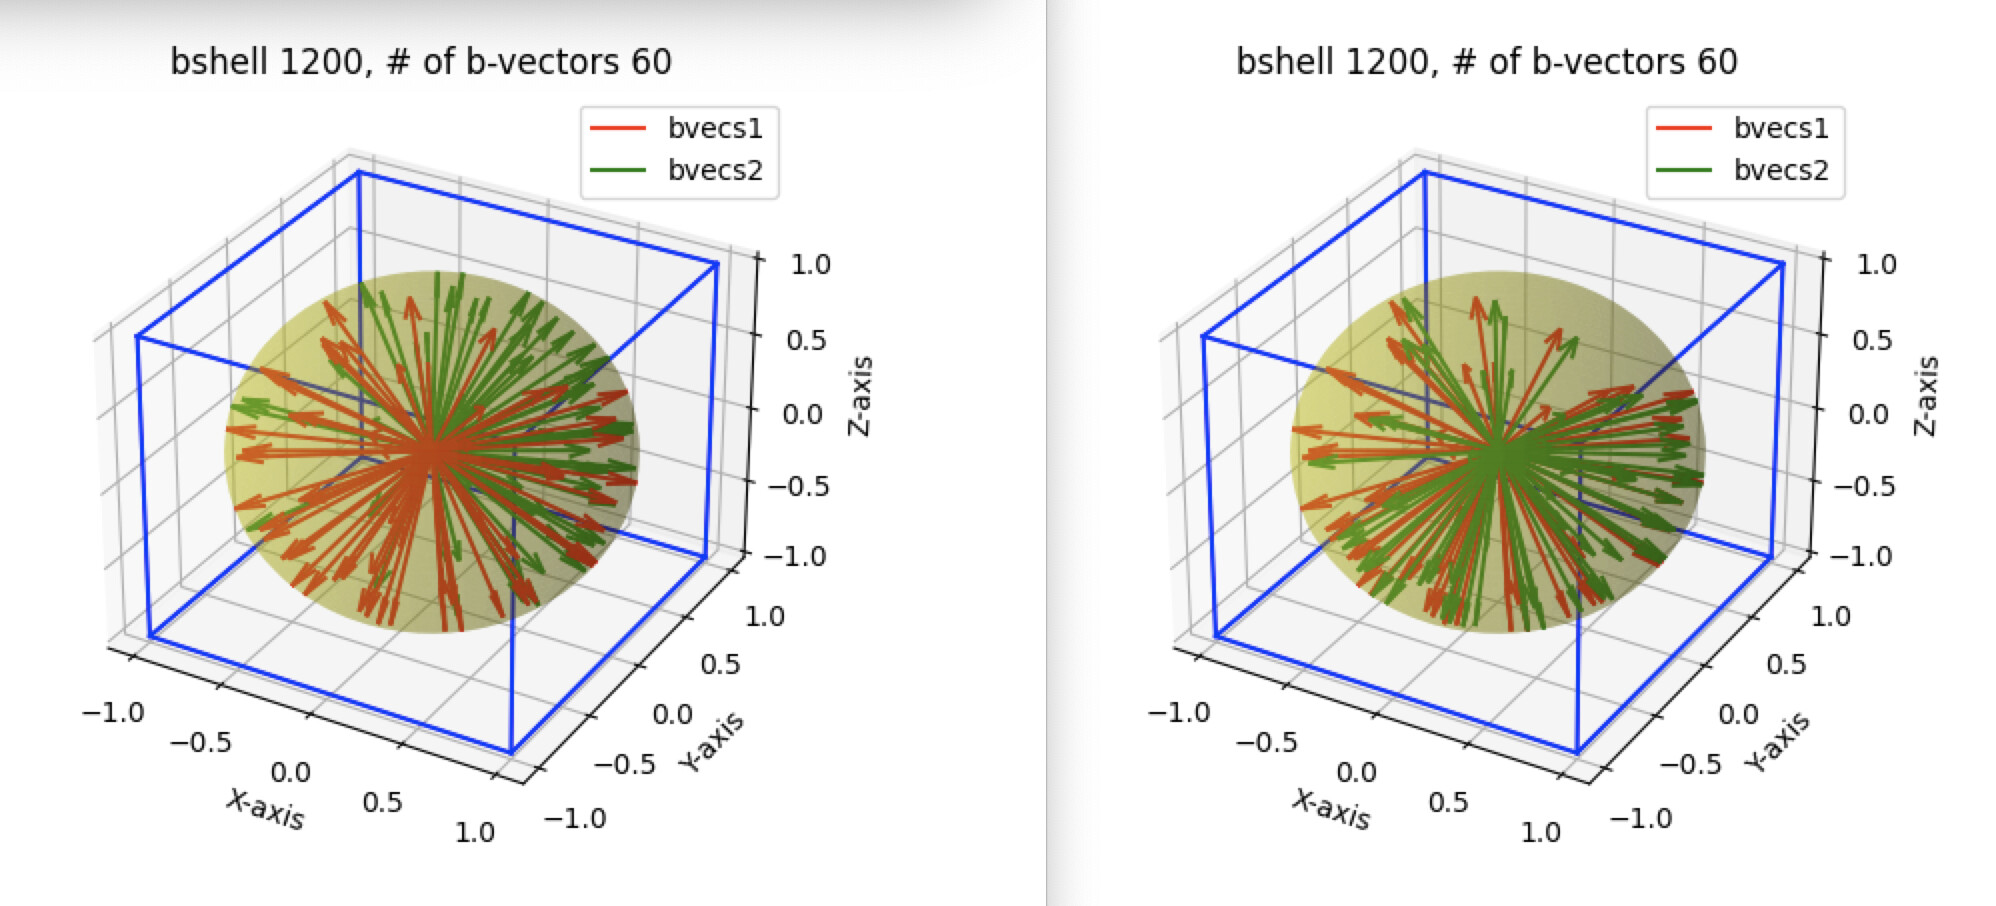
Here is some visualizations from the data. The red bvec set on both left and right are the m.h.DTI_sequencename.bvec_original for subject1. On the left I am comparing them to the bvec set m.h.DTI_sequencename.bvec in green (which I presume is FSL bvecs, output by dicm2nii and identical to the output of dcm2niix). The green vectors don’t appear to be simply a rotation (computing angles between corresponding bvecs shows different angles). On the right I am comparing m.h.DTI_sequencename.bvec_original from Subject1 (red) and that from Subject 2 (green). Here most bvecs are same, but some are negated (again confirmed by calculating angles between corresponding bvecs, most ~0 degrees, some ~180).
Once I make sense of these data which are all only from the dicoms, I can then move on to explaining the differences between the FSL bvecs output by the converters and what came with the nifti dataset + bvec/bval files generated by unknown pipeline. Based on what you said so far, my best hypothesis remains that those were rotated based on some estimated motion, although the negations are odd.
Unfortunately this is from a much older system, and we don’t have the “DiffusionScheme” field.
@Chris_Rorden do you have an explanation for the data in the visualizations above ? Specifically, the difference in bvec_original and bvec that is NOT a rotation (on the left), and the bvec_original differing from session-to-session only by a few vectors being negated, other identical (on the right).