Hey, I am trying to create results tables for an analysis that I ran using Nilearn’s non_parametric_inference. And I ran into a slight inconvenience.
(If you have not tried working with Nilearn yet… stop with whatever you are doing and try it out right now, it’s awesome).
TLDR: I intend to report both uncorrected and corrected results. Since the non_parametric_inference function does not include uncorrected p-value map in the results output, I generated it myself with some custom code. To my surprise, I found differences in cluster sizes when I compare my uncorrected p<0.001 results with the cluster-wise corrected results from non_parametric_inference. I am unsure if I am running into a bug or whether I am making an error myself. So that’s why I am posting here instead of the GitHub issues page.
How I got here
My design matrix (HCvMD_design_matrix) looks like this:
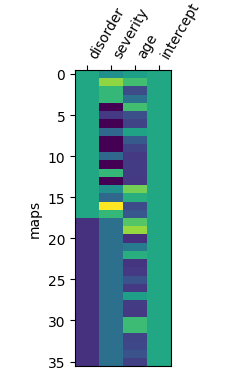
I have 2x18 brain maps, and 4 regressors. So, as far as my statistical knowledge goes, the degrees of freedom for this model is 36-4=32.
Next, I ran a non-parametric test, with a cluster threshold of 0.001:
HCvMD_out_dict = non_parametric_inference(
    ls_imgs,
    design_matrix=HCvMD_design_matrix,
    mask=second_level_mask,
    model_intercept=True,
    second_level_contrast="disorder",
    two_sided_test=True,
    smoothing_fwhm=6,
    n_jobs=8,
    threshold=0.001
)
[insert 4m43.9s waiting music here]
After I grabbed some coffee, I first wanted to see the uncorrected results table. I used the get_clusters_table function. By means of trial and error (childhood habit), I found out that this function only produces sub-clusters for z-maps, and not for 10logP maps. So, I masked the t-value map from non_parametric_inference using cluster-size error control map, converted the map into Z values, and then produced the cluster table:
# Create t to z conversion function
def t_to_z(t_scores, deg_of_freedom):
    p_values = scipy.stats.t.sf(t_scores, df=deg_of_freedom)
    z_values = scipy.stats.norm.isf(p_values)
    return z_values

# Set threshold
unc_pval=0.001
dof = len(ls_subjects) - 4 # DOF: group, covar1, covar2, intercept
threshold = stats.t.isf(unc_pval / 2, df=dof) # two-sided

# Create mask for p<0.001 uncorrected threshold
HCvMD_thr_mask_img = math_img(f'(img < {-threshold}) | (img > {threshold})', img=HCvMD_out_dict['t'])
HCvMD_masked_data = masking.apply_mask(HCvMD_out_dict['t'], HCvMD_thr_mask_img)
HCvMD_masked_img = masking.unmask(HCvMD_masked_data, HCvMD_thr_mask_img)

# Convert to z-map
z_img = new_img_like(
    HCvMD_masked_img, t_to_z(get_data(HCvMD_masked_img), deg_of_freedom=dof))

# Create cluster table
clusters = get_clusters_table(z_img, stat_threshold=0, cluster_threshold=10, two_sided=True)
clusters = clusters.round({'X': 0, 'Y': 0, 'Z': 0})
clusters.style.format({'X': '{:,.0f}'.format,
                             'Y': '{:,.0f}'.format,
                             'Z': '{:,.0f}'.format})
This gives me the following table:
| Cluster ID | X | Y | Z | Peak Stat | Cluster Size (mm3) | |
|---|---|---|---|---|---|---|
| 0 | 1 | 4 | -86 | 10 | 4.876244 | 5552 |
| 1 | 1a | -18 | -78 | 8 | 4.592168 | |
| 2 | 2 | 20 | -76 | 8 | 4.810282 | 1312 |
| 3 | 3 | 16 | -20 | -4 | 3.854187 | 496 |
| 4 | 4 | -40 | -74 | -50 | 3.754792 | 152 |
| 5 | 5 | -8 | -16 | -0 | 3.725331 | 96 |
| 6 | 1 | 52 | -66 | 14 | -3.508029 | 96 |
Now, in theory, if I find any significant clusters using the cluster-size error control p-map, the cluster sizes of these surviving clusters should be the same, since I used a threshold of 0.001 (two-sided) in both cases. Right?
The resulting cluster-wise error corrected contrast looks like this:
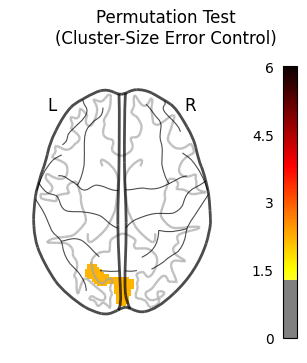
Oh cool! I found something!.

This could be the first cluster from the table above. (Obviously I know MNI coorinates from the top of my head, like everyone else ![]() ).
).
Let’s have a look…
# Create mask for p<0.05 cluster-size error corrected
HCvMD_thr_mask_img2  = binarize_img(HCvMD_out_dict['logp_max_size'], threshold=1.3)
HCvMD_masked_data2 = masking.apply_mask(HCvMD_out_dict['t'], HCvMD_thr_mask_img2)
HCvMD_masked_img2 = masking.unmask(HCvMD_masked_data2, HCvMD_thr_mask_img2)

# Convert to z-map
z_img = new_img_like(
    HCvMD_masked_img2, t_to_z(get_data(HCvMD_masked_img2), deg_of_freedom=dof))

# Create cluster table
clusters = get_clusters_table(z_img, stat_threshold=0, cluster_threshold=10, two_sided=True)
clusters = clusters.round({'X': 0, 'Y': 0, 'Z': 0})
clusters.style.format({'X': '{:,.0f}'.format,
                             'Y': '{:,.0f}'.format,
                             'Z': '{:,.0f}'.format})
(yes, I know, I could’ve used more infomative variable names, but this was my quick and dirty attempt…)
This gives me the following table:
| Cluster ID | X | Y | Z | Peak Stat | Cluster Size (mm3) | |
|---|---|---|---|---|---|---|
| 0 | 1 | 4 | -86 | 10 | 4.876244 | 5744 |
| 1 | 1a | -18 | -78 | 8 | 4.592168 |
Ah, that’s the same cluster indeed! However… everything looks the same except for the cluster size.
I figured that this must have something to do with the initial thresholding. So, I started changing the DOF value in my uncorrected result (that childhood habit again…) and found the exact same cluster size result when I changed dof = len(ls_subjects) - 4 to dof = len(ls_subjects) - 2.
So, now I am wondering what’s going wrong. Did I make a mistake in my assumptions? Or is there something else going on?
In the permuted_ols source code, I see that covariates are first regressed out of the data before the permutation tests are being run on the residuals (correct me if I’m wrong). And if I run through the code with a debugger, the code uses 34 DOF instead of 32 DOF. In the line dof = n_samples - (n_regressors + n_covars), n_regressors is set to 1 and n_covars is also set to 1 but I do not understand why.
Do you have any idea @ymzayek?