EPI to T1 registration visualization

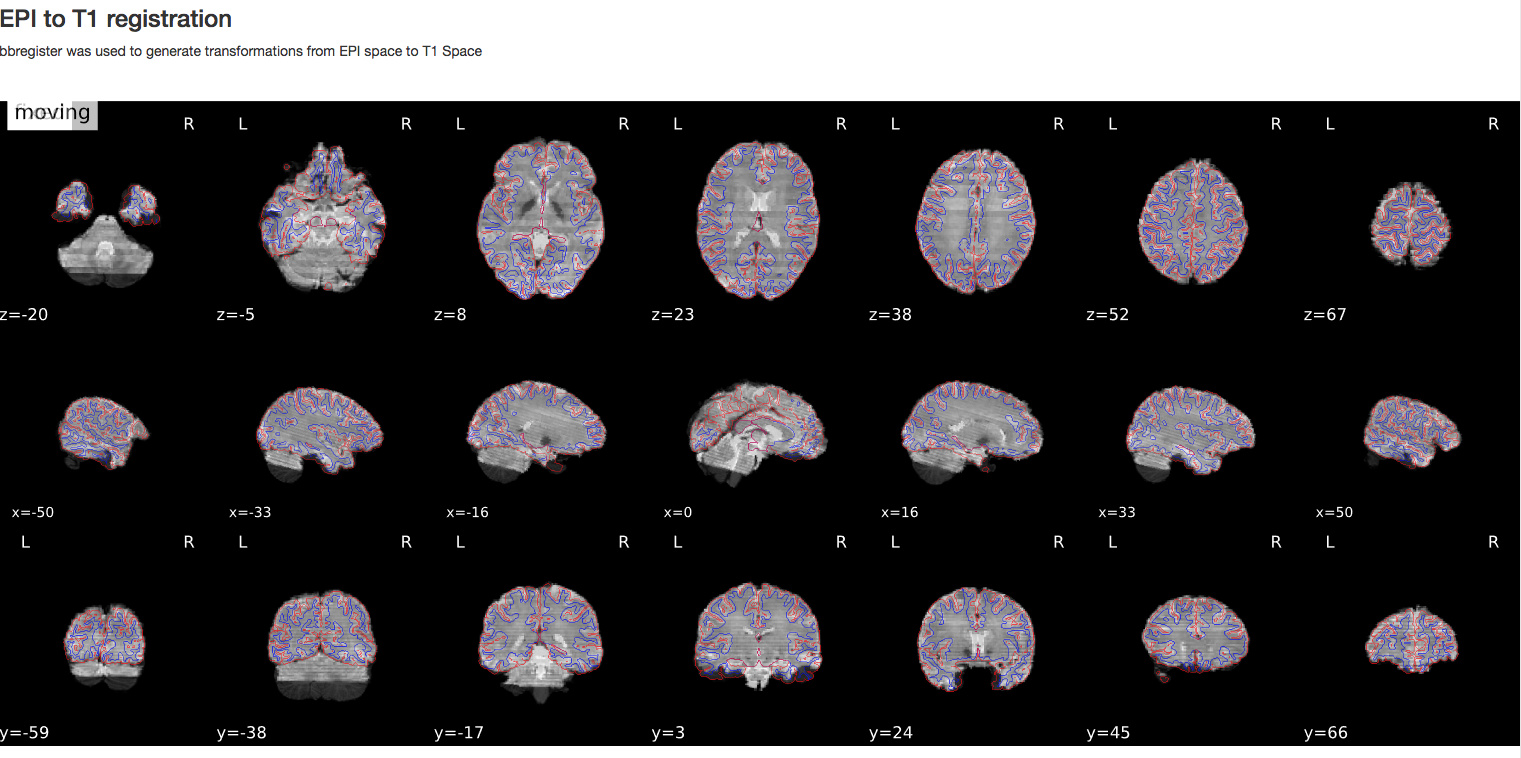
I was wondering what is the functional image that is used to visualize the EPI to T1 registration results? I ask because the image below shows very strong slice effect. But when I check the preprocessed fMRI data they look fine… I use fmriprep 1.0.12.

Thanks!

We estimate a reference image from the first few volumes.

https://fmriprep.readthedocs.io/en/stable/workflows.html#bold-reference-image-estimation

This looks like a spin history effect.

To quote myself:

3 Likes

Just to mention that we are using nearest neighbor in this interpolation, to make those artifacts more obvious.

When resampling for analysis purposes, we use lanczos, which should introduce a certain degree of smoothing between slices.