Hey all,
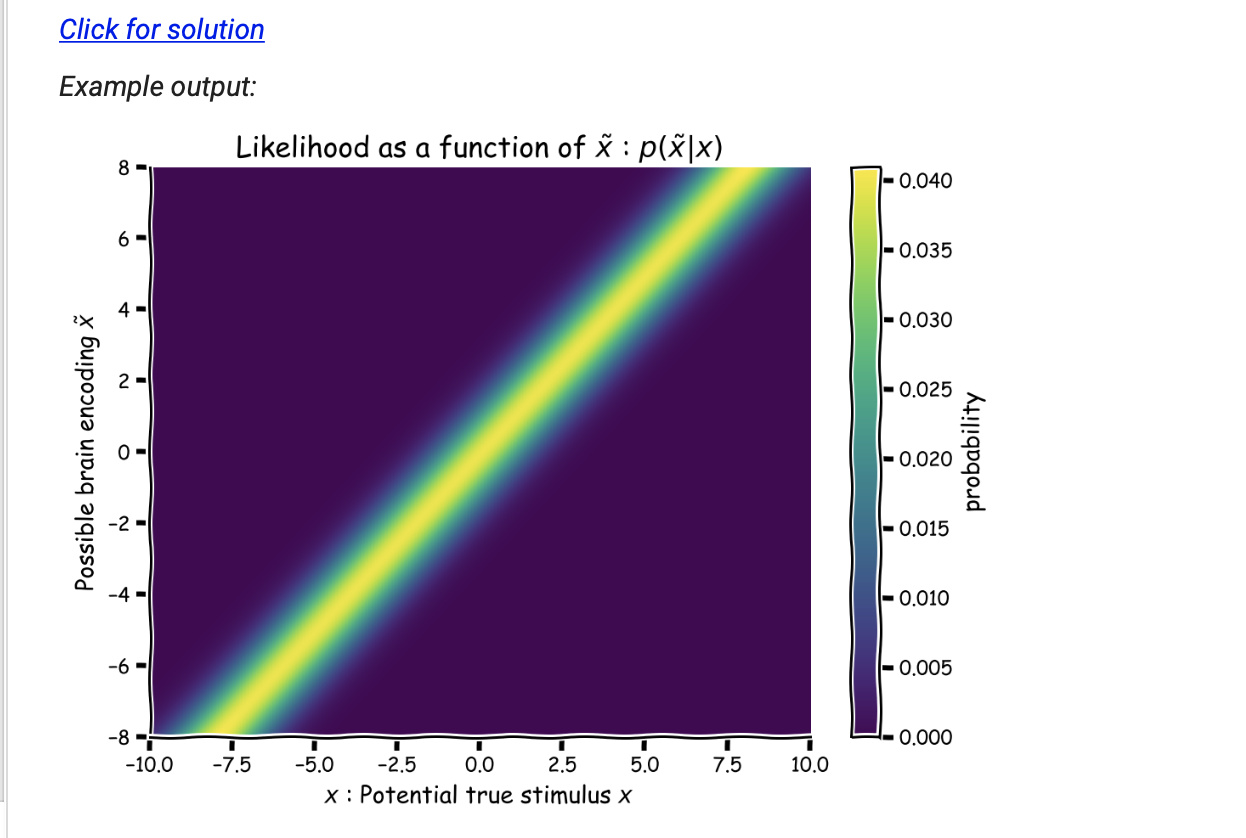
Just wanted to point out that there’s a critical error in one of the hidden functions of the notebook for tutorial 3 of Bayes day, which has the potential to confuse people quite a bit. This becomes clear when you look at the first graph of brain encoded stim x tilde given true stim x:
What we see here that’s very strange, is that for values of the true stimulus that are positive, instead of a gaussian centered around the true value, we see a gaussian centered around the negative of Xtrue. This is of course not a very accurate approximation of the value. We can confirm that this is a graphing error by looking at the actual values of hypothetical stim and the corresponding likelihood array:
print(hypothetical_stim[0],x[np.argmax(likelihood_array[0,:])])
print(hypothetical_stim[-1],x[np.argmax(likelihood_array[-1,:])])
which returns
-8.0 -8.000000000000007
8.0 7.999999999999936
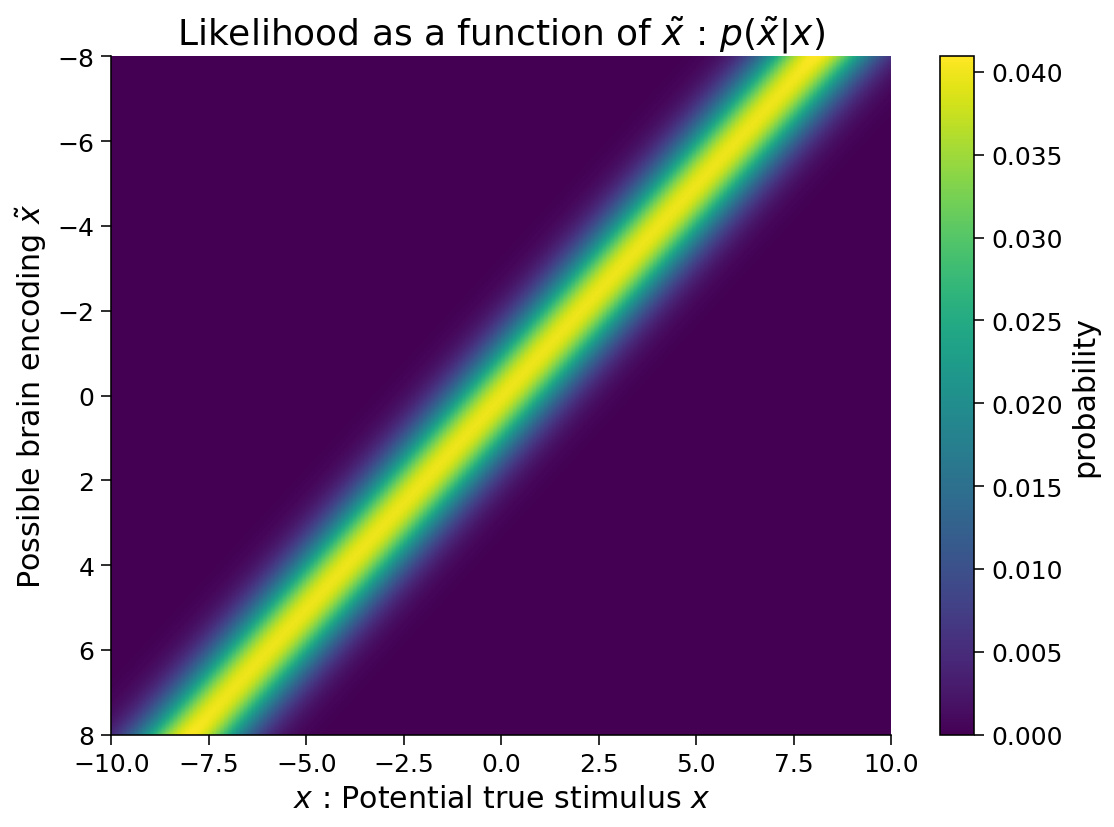
Aha, so the actual peak of our pdf is centered around the true value of x, despite what the graph suggests! So what’s going wrong here then? Well, the culprit is the function used to plot the graph, plot_myarray(), which is hidden in the helper function cell at the start of the notebook.
Looking at this function, it uses plt.imshow(myarray) to convert our arrays to heatmaps. The issue here, is that we are not using the origin argument. This causes imshow to plot our array in completely the wrong order: starting with the first row `likelihood_array[0,:] at the top, which as we can see from the image’s x axis should instead correspond to the likelihood array if x==8.
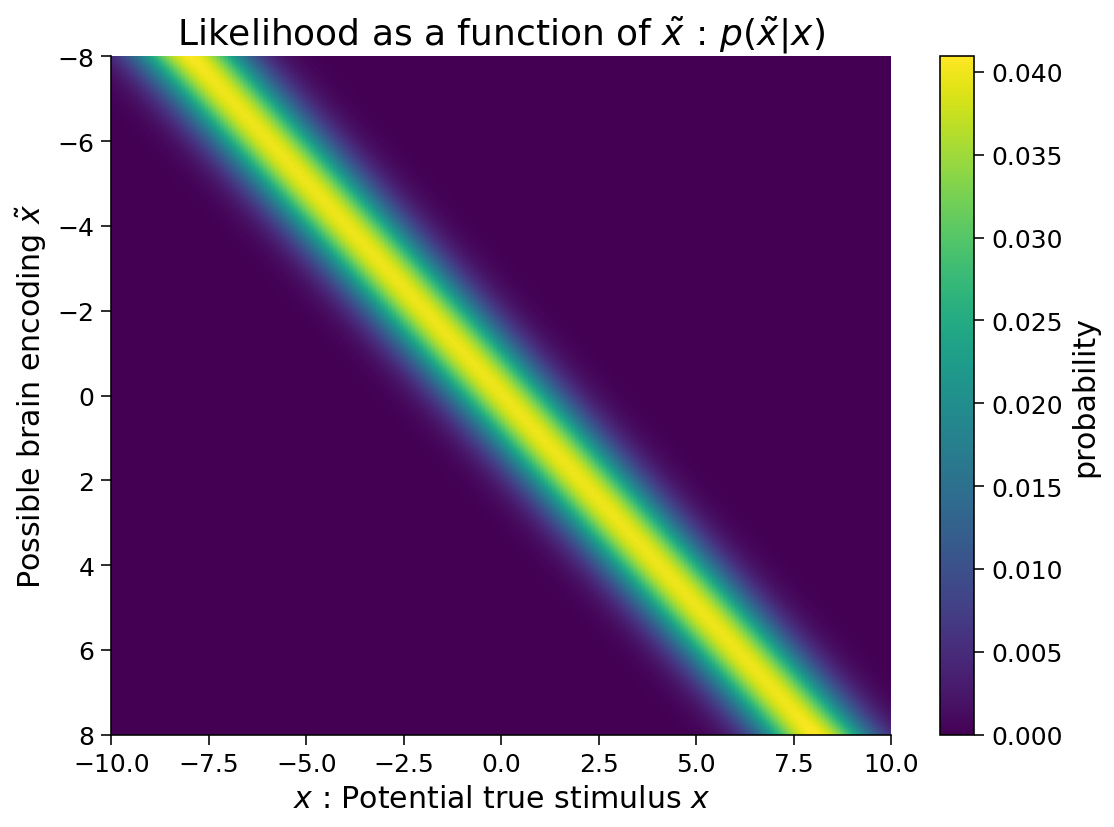
So how do we fix this? There’s a very simple bugfix: in the hidden cell, in the plot_myarray() function, add origin='lower' as an argument to imshow. This fixes the axes of all graphs in the notebook!:
Hope this clarifies some things for people who were confused by this.
PS: Note that all examples will remain ploted the wrong way around, as they have been prepared in advance. If your image is a mirror image of the example, you did it correctly!
PPS: I’ve also opened an issue on the github repo to address this issue