Hello everyone, I am a novice user of nilearn, and I want to extract a default network (One of my preprocessed fMRI data) of fMRI data through DictLearning. what should I do?
thanks!
Hi there,
This tutorial demonstrates the extraction of the default mode network:
https://nilearn.github.io/auto_examples/03_connectivity/plot_sphere_based_connectome.html#sphx-glr-auto-examples-03-connectivity-plot-sphere-based-connectome-py
And this tutorial demonstrates the usage of dictionary learning in Nilearn:
https://nilearn.github.io/auto_examples/03_connectivity/plot_extract_regions_dictlearning_maps.html#sphx-glr-auto-examples-03-connectivity-plot-extract-regions-dictlearning-maps-py
Some combination of the 2 should get you to what you need
Thanks,
Chris
1 Like
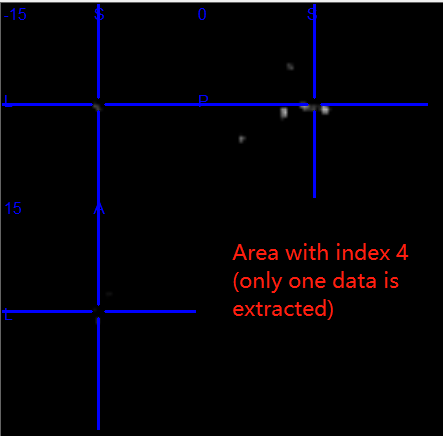
Thanks for your reply, through your suggestion I extracted an area of data (img = image.index_img(components_img, 4)). But I don’t know if there is a problem. In addition, I have another question. If I want to extract other networks (specific networks, such as: default network, motion network, execution control network, memory network), how can I know the indexes of these networks?
Some codes are as follows:
dataset = datasets.fetch_adhd(n_subjects=20)
#
func_filenames = dataset.func[0]
# func_filenames = rest_dataset.func
# confounds = rest_dataset.confounds
from nilearn.decomposition import DictLearning
# Initialize DictLearning object
dict_learn = DictLearning(n_components=8, smoothing_fwhm=6.,
                          memory="nilearn_cache", memory_level=2,
                          random_state=0)
# Fit to the data
dict_learn.fit(func_filenames)
components_img = dict_learn.components_img_
# Visualization of functional networks
# Show networks using plotting utilities
from nilearn import plotting
plotting.plot_prob_atlas(components_img, view_type='filled_contours',
                         title='Dictionary Learning maps')
# plotting.show()
from nilearn.regions import RegionExtractor

extractor = RegionExtractor(components_img, threshold=0.5,
                            thresholding_strategy='ratio_n_voxels',
                            extractor='local_regions',
                            standardize=True, min_region_size=1350)
# Just call fit() to process for regions extraction
extractor.fit()
regions_extracted_img = extractor.regions_img_
# Each region index is stored in index_
regions_index = extractor.index_
# Total number of regions extracted
n_regions_extracted = regions_extracted_img.shape[-1]

# Visualization of region extraction results
title = ('%d regions are extracted from %d components.'
         '\nEach separate color of region indicates extracted region'
         % (n_regions_extracted, 8))
plotting.plot_prob_atlas(regions_extracted_img, view_type='filled_contours',
                         title=title)

# First, we plot a network of index=4 without region extraction (left plot)
from nilearn import image

img = image.index_img(components_img, 4)

img.to_filename('new_dmn_2.nii.gz')