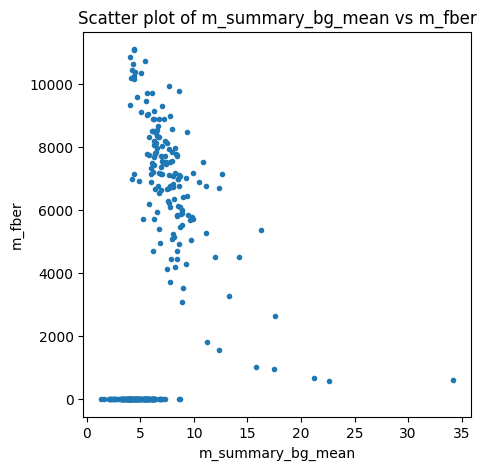
I’m having subjects get a fiber score of -1. Not sure what the cause is. Found many with this error: estimated signal variation in background is too small. Not all of those with the error got a fber of -1. Thoughts? What could cause this (score of -1)? And is it related to the error?
Hello,
I am also interested in this topic. Has anyone determined the cause of a FBER score of -1 (MRIQC of T1w data)?
Best,
Jenna
Here’s the code from mriqc for calculating FBER. Looks like if the median of the square of airmask is less than .001 it will return -1:
    fg_mu = np.median(np.abs(img[headmask > 0]) ** 2)

    airmask = np.ones_like(headmask, dtype=np.uint8)
    airmask[headmask > 0] = 0
    if rotmask is not None:
        airmask[rotmask > 0] = 0
    bg_mu = np.median(np.abs(img[airmask == 1]) ** 2)
    if bg_mu < 1.0e-3:
        return -1.0
    return round(float(fg_mu / bg_mu), decimals)
Hi,
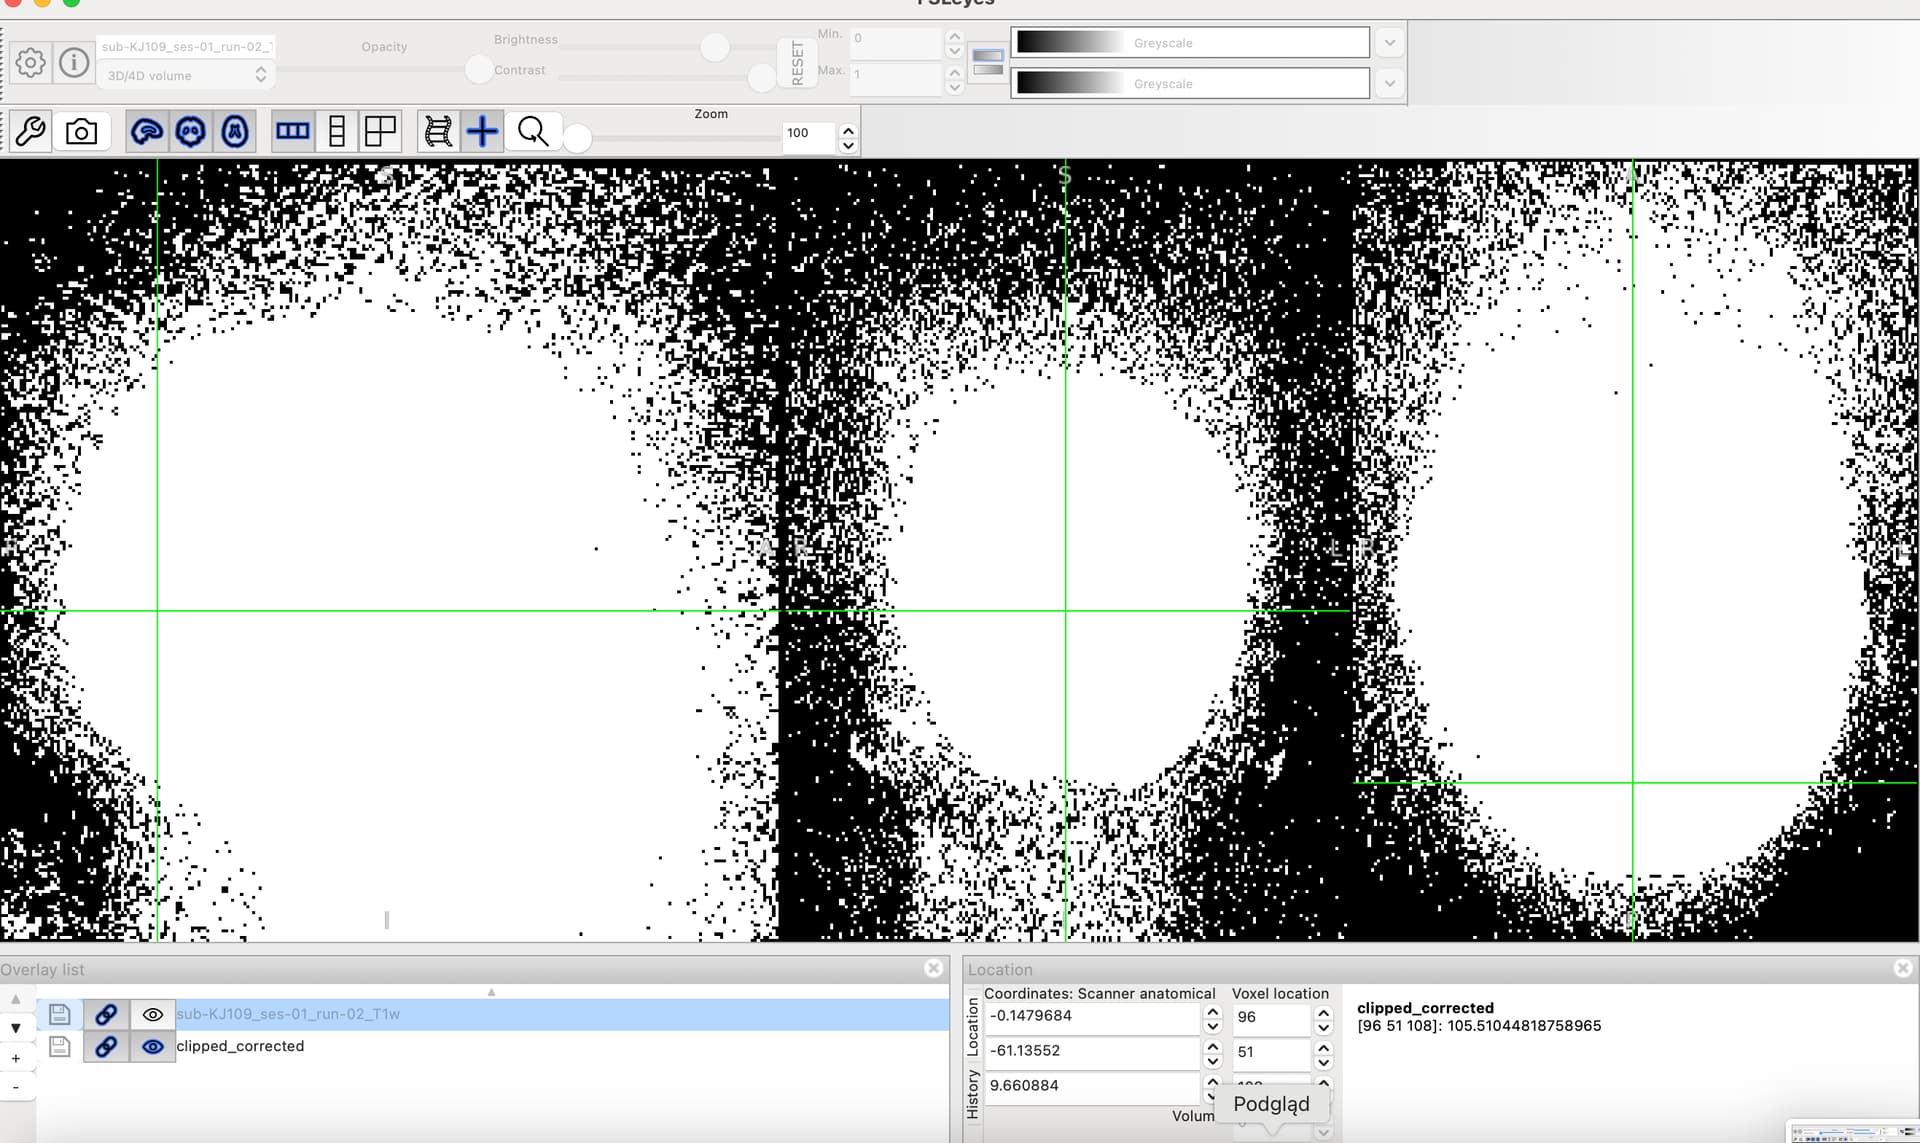
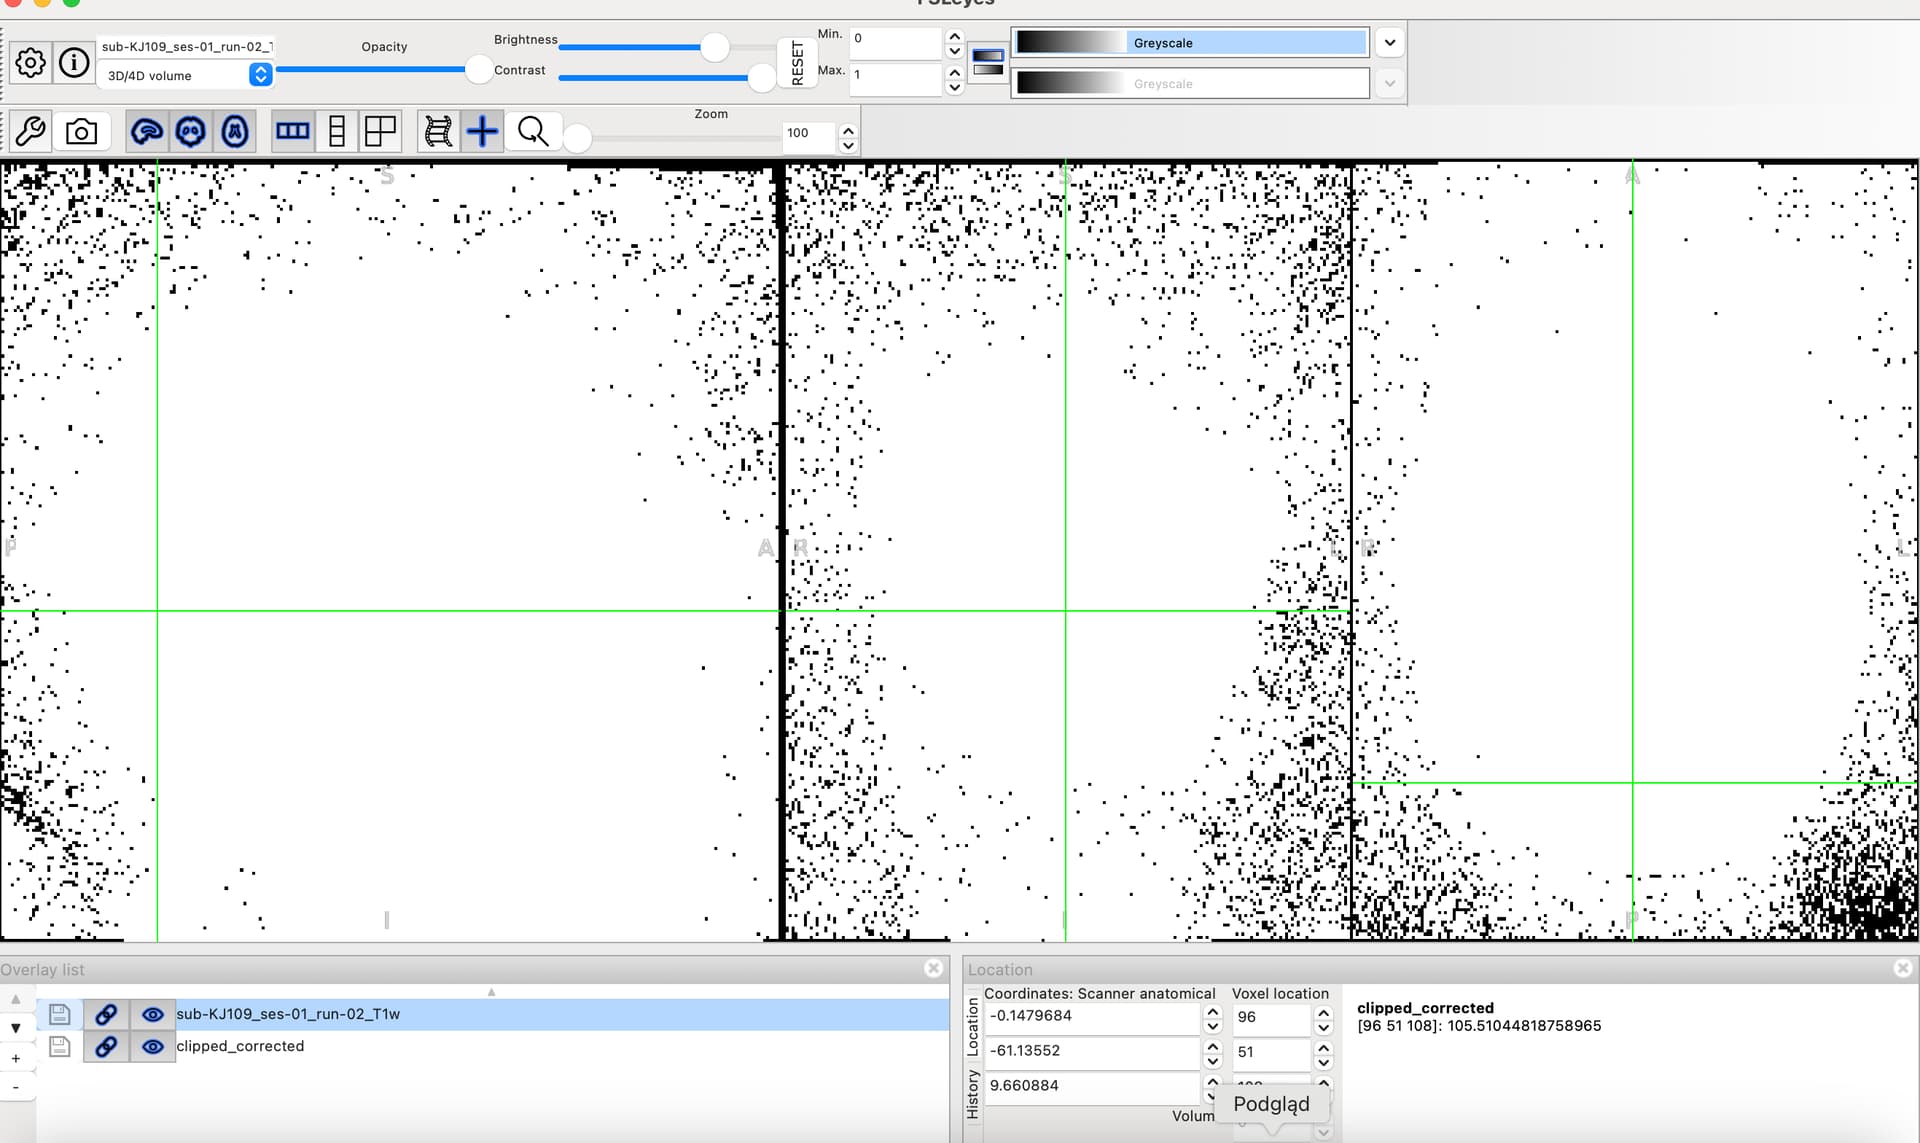
I’m experiencing the same issue with our new short T1w sequence. I’ve tried modifying the code above, for example, setting bg_mu < 1.0e-9 but with no success. I do observe low but reasonable background noise, as shown in the example image and group plot. I also tried an alternative method, RadQA, which provides a very meaningful fBER that aligns well with our visual quality scores.

I’d like to add to my previous post that, I am confused about how many zeroes in the image returns mriqc workflow vs how many zeroes there are actually in the image:
    nifti_path = "mriqc_debug/sub-KJ109_ses-01_run-02_T1w.nii.gz"
    img = nib.load(nifti_path)

    img=img.get_fdata()

    zeros = np.sum(img == 0.0)
    non_zeros = np.sum(img > 0.0)
    print(f"all zeros: {zeros}, non zeros: {non_zeros}")

all zeros: **908348**, non zeros: 11674564
vs mriqc anatomical.py
    zeros = np.sum(img[airmask == 1] == 0)
    non_zeros = np.sum(img[airmask == 1] > 0)
    print(f"airmasked zeros: {zeros}, non zeros: {non_zeros}")
    zeros = np.sum(img == 0)
    non_zeros = np.sum(img > 0)
    print(f"all zeros: {zeros}, non zeros: {non_zeros}")

    bg_mu = np.median(np.abs(img[airmask == 1]) ** 2)
    print(f"bg_mu: {bg_mu}")
    if bg_mu == 0.0:
       return -1.0
    return round(float(fg_mu / bg_mu), decimals)

airmasked zeros: **4710457**, non zeros: 3820614
all zeros: **5028033**, non zeros: 7554879
Then I compared INU corrected image to original. It looks like the correction results in many zeroed voxels. Do You think that it is correct?
I hadn’t heard of RadQy, interesting project. I’ve enjoyed going through its code.
Good call comparing the pre and post INU corrected image. If I’m reading the input and output hook ups from the MRIQC workflows correctly another source of difference may becoming from the Harmonize interface. It gets passed the INU corrected image, does some thresholding, and then gets used by the StructuralQC interface. Harmonize was updated in April, so master may behave differently than the current stable release:
Previous:
Current:
Changes:
I think RadQy is doing something similar at a similar stage in the workflow but is using Otsu’s method for determining a threshhold:
https://scikit-image.org/docs/0.25.x/auto_examples/segmentation/plot_thresholding.html