Hi everyone,
I am trying to generate percent signal change images for some pre/post treatment functional task images. I am following the Mumford guide linked below, but I am a little confused about identifying the values for establishing scale factor.
https://jeanettemumford.org/assets/files/perchange_guide.pdf
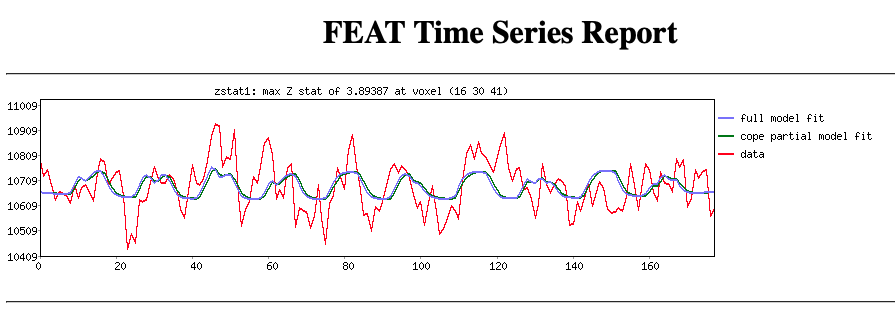
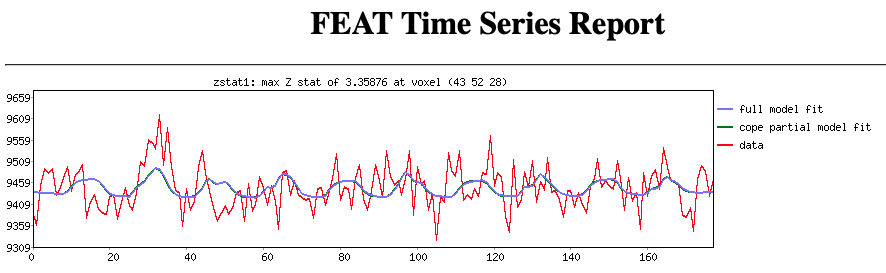
We are doing an interleaved-TMS/fMRI study, so the participants are receiving single pulses of stimulation at set intervals for all sessions, and we are looking at both overall signal change specific engagement of the sgACC. We are using fmriprep to preprocess the images, and then FSL FEAT to model the “task” events (i.e. single pulse stimulation at the intervals). From the FEAT model, I am running Featquery to generate the time series plot of the signal over the model.
Examples:
My question is how to determine the scale factor for use in this command:
fslmaths filtered_func_data -mul scale_factor -div mean_func
-mul mask_image output_image
Mumford provides this equation for determining scale factor:
![]()
We are not using any contrasts in the GLM, but I’m not sure how to interpret the baseline-to-max range part. Would that be a matter of visually interpreting the model fit for every Featquery output and using that in the fslmaths calculation? Or something else?
Thanks in advance!