Dear fMRIPREP users,
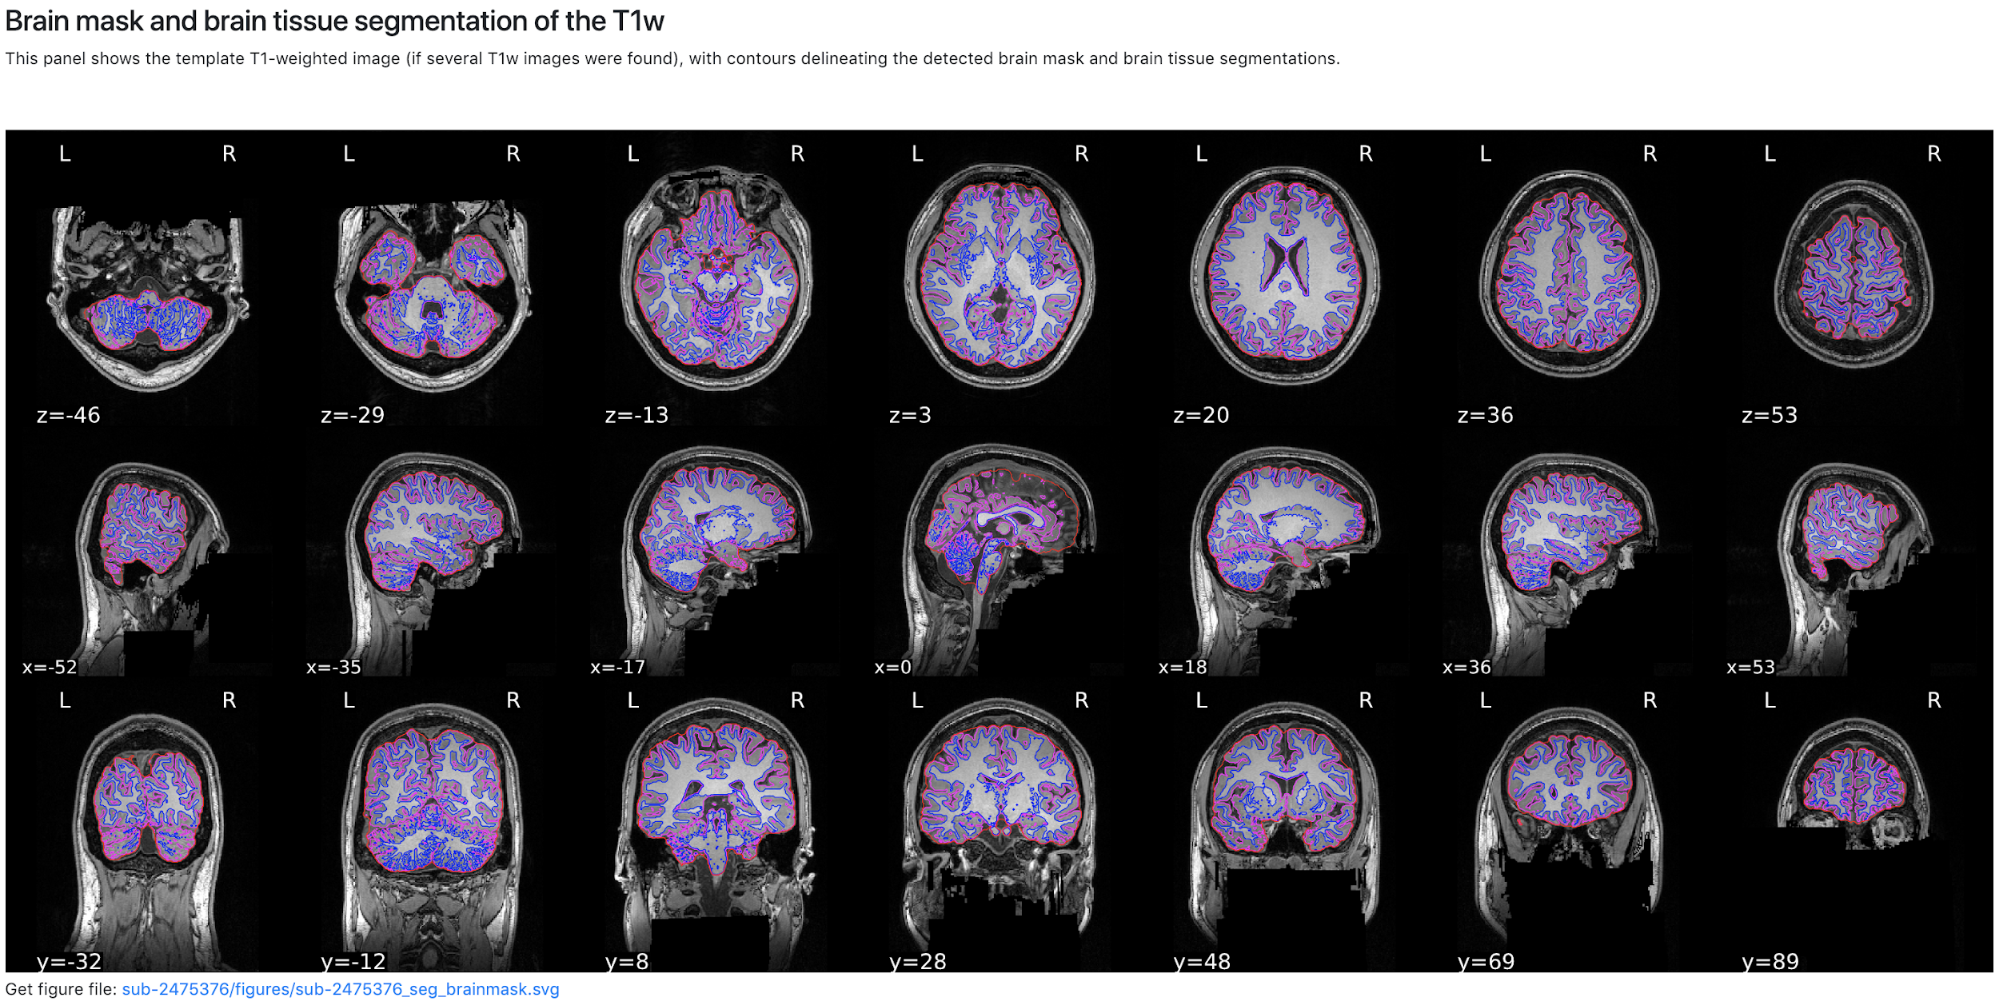
Using screenshots of FreeSurfer (v6), I would like to create a similar grid as have been done in the visual reports of fMRIPrep .
However, I was not able to find the script or piece of code on the Github of this part. Perhaps, I missed it but could anyone indicate the script or a way to achieve this visual representation? It would really help me out!
Thank you in advance!
We use a modified ReconAll nipype interface that constructs the image after the fact:
class ReconAllRPT(nrc.SurfaceSegmentationRC, freesurfer.preprocess.ReconAll):
    input_spec = _ReconAllInputSpecRPT
    output_spec = _ReconAllOutputSpecRPT


    def _post_run_hook(self, runtime):
        ''' generates a report showing nine slices, three per axis, of an
        arbitrary volume of `in_files`, with the resulting segmentation
        overlaid '''
        outputs = self.aggregate_outputs(runtime=runtime)
        self._anat_file = os.path.join(outputs.subjects_dir,
                                       outputs.subject_id,
                                       'mri', 'brain.mgz')
        self._contour = os.path.join(outputs.subjects_dir,
                                     outputs.subject_id,
                                     'mri', 'ribbon.mgz')
        self._masked = False


        NIWORKFLOWS_LOG.info('Generating report for ReconAll (subject %s)',
                             outputs.subject_id)


        return super(ReconAllRPT, self)._post_run_hook(runtime)
Just to follow the breadcrumbs a bit, this depends on functionality in the SurfaceSegmentationRC interface:
class SurfaceSegmentationRC(reporting.ReportCapableInterface):
    """An abstract mixin to registration nipype interfaces."""
    _anat_file = None
    _mask_file = None
    _contour = None


    def _generate_report(self):
        """Generates the visual report."""
        from niworkflows.viz.utils import plot_registration
        NIWORKFLOWS_LOG.info('Generating visual report')


        anat = load_img(self._anat_file)
        contour_nii = load_img(self._contour) if self._contour is not None else None


        if self._mask_file:
            anat = unmask(apply_mask(anat, self._mask_file), self._mask_file)
            mask_nii = load_img(self._mask_file)
        else:
            mask_nii = threshold_img(anat, 1e-3)
show original
This requires visualization functions to (1) determine the slices:
def cuts_from_bbox(mask_nii, cuts=3):
    """Finds equi-spaced cuts for presenting images"""
    from nibabel.affines import apply_affine


    mask_data = np.asanyarray(mask_nii.dataobj) > 0.0


    # First, project the number of masked voxels on each axes
    ijk_counts = [
        mask_data.sum(2).sum(1),  # project sagittal planes to transverse (i) axis
        mask_data.sum(2).sum(0),  # project coronal planes to to longitudinal (j) axis
        mask_data.sum(1).sum(0),  # project axial planes to vertical (k) axis
    ]


    # If all voxels are masked in a slice (say that happens at k=10),
    # then the value for ijk_counts for the projection to k (ie. ijk_counts[2])
    # at that element of the orthogonal axes (ijk_counts[2][10]) is
    # the total number of voxels in that slice (ie. Ni x Nj).
    # Here we define some thresholds to consider the plane as "masked"
    # The thresholds vary because of the shape of the brain
    # I have manually found that for the axial view requiring 30%
show original
(2) Generate the tiles
def plot_registration(anat_nii, div_id, plot_params=None,
                      order=('z', 'x', 'y'), cuts=None,
                      estimate_brightness=False, label=None, contour=None,
                      compress='auto'):
    """
    Plots the foreground and background views
    Default order is: axial, coronal, sagittal
    """
    plot_params = {} if plot_params is None else plot_params


    # Use default MNI cuts if none defined
    if cuts is None:
        raise NotImplementedError  # TODO


    out_files = []
    if estimate_brightness:
        plot_params = robust_set_limits(anat_nii.get_fdata().reshape(-1),
                                        plot_params)


    # FreeSurfer ribbon.mgz
show original
(3) Compose the tiles into a grid
def compose_view(bg_svgs, fg_svgs, ref=0, out_file='report.svg'):
    """
    Composes the input svgs into one standalone svg and inserts
    the CSS code for the flickering animation
    """
    import svgutils.transform as svgt


    if fg_svgs is None:
        fg_svgs = []


    # Merge SVGs and get roots
    svgs = bg_svgs + fg_svgs
    roots = [f.getroot() for f in svgs]


    # Query the size of each
    sizes = []
    for f in svgs:
        viewbox = [float(v) for v in f.root.get("viewBox").split(" ")]
        width = int(viewbox[2])
        height = int(viewbox[3])
show original
1 Like
Thank you for your very fast and detailed answer!
Cheers!
The easy way is to point it at a pre-run FreeSurfer directory (you need FreeSurfer and nipype installed):
from niworkflows.interfaces.segmentation import ReconAllRPT

ReconAllRPT(subjects_dir="/path/to/subjects",
            subject_id="sub-XX",
            out_report="/path/to/output.svg").run()
Assuming that the subject is fully run, this should take very little time, and will save the result in /path/to/output.svg.
2 Likes
