Thank you for the pointer, Professor. You are right — after removing the diagonal and comparing against the SC matrix, the FC shows no modular structure and the FC-SC correlation is effectively zero (r = 0.04). The current output is noise-driven rather than connectivity-driven.
I suspect the noise amplitude (nsig=0.01) is too high relative to the coupling strength, masking any structure that should emerge from the SC. I am now tuning the parameters — reducing noise and increasing coupling — to bring the system into a regime where oscillations are genuinely driven by the connectivity structure rather than injected noise.
I will share updated FC and SC plots once the parameters produce a structured FC.
Best regards,
M Srikanth
Day 7:
Hey Prof. Marinazzo!
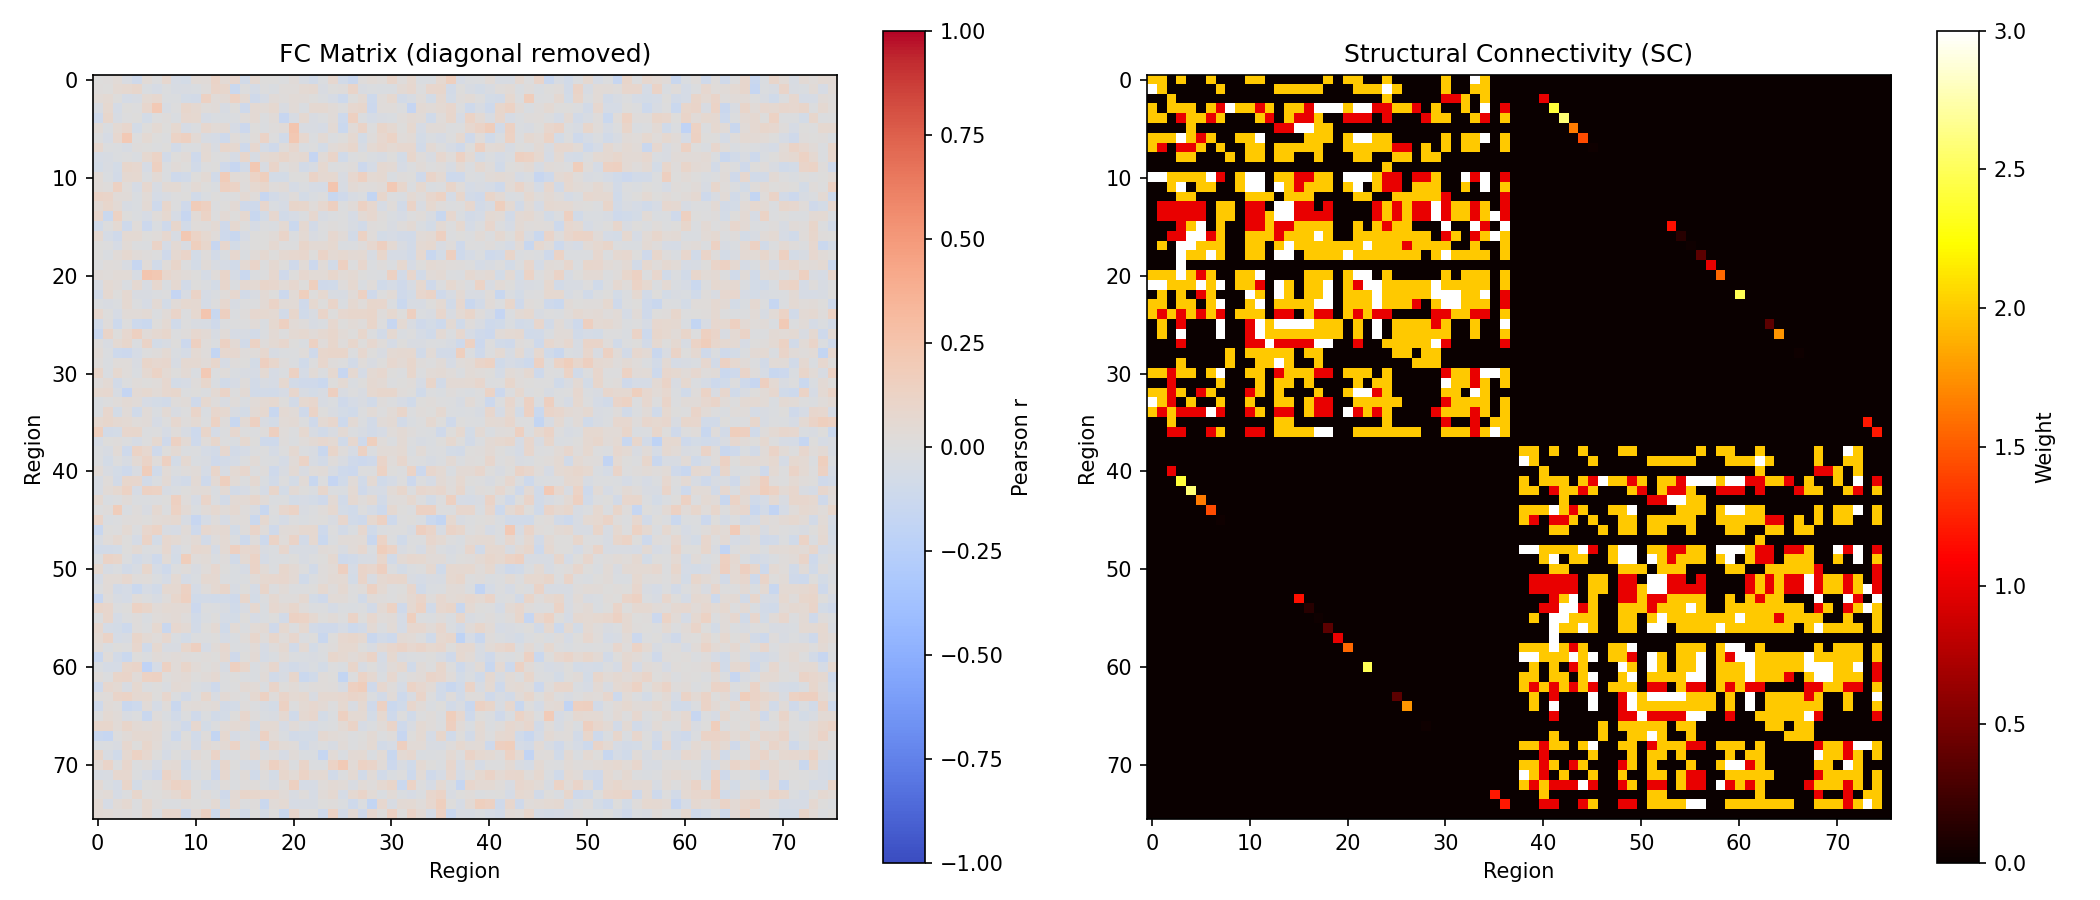
Thank you for the feedback, Professor. After removing the diagonal and checking against the SC, I confirmed the previous output was noise-driven (FC-SC r = 0.04). I reduced the noise amplitude (nsig: 0.01 → 0.0001) and increased the coupling strength (a: 0.0042 → 0.042), which has brought the system into a genuinely connectivity-driven regime.
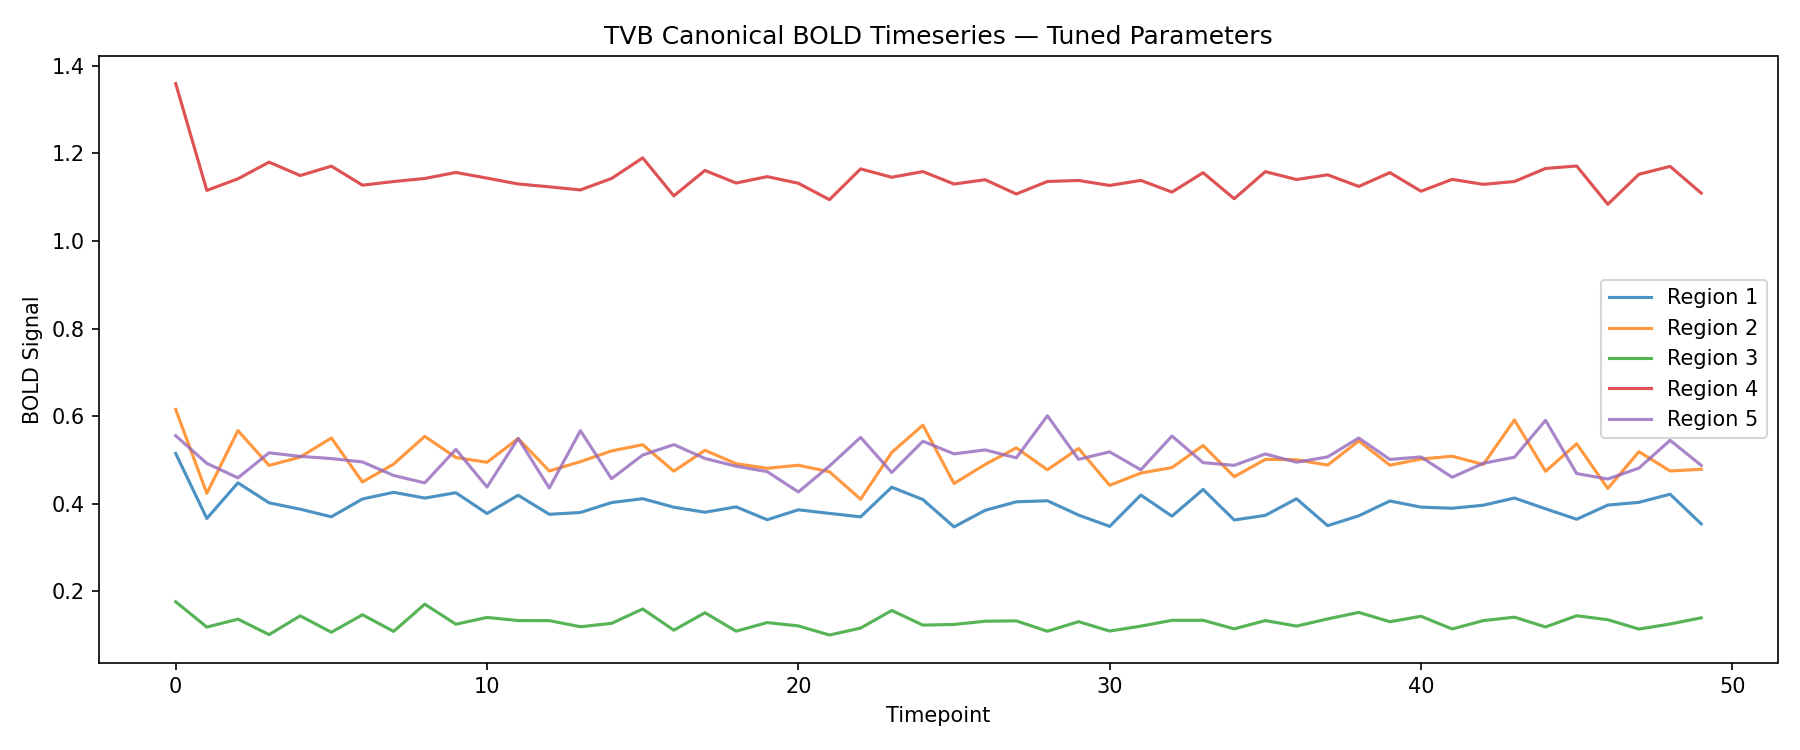
The updated FC-SC correlation is now 0.287 and the FC matrix shows clear modular structure with some resemblance to the SC. Attaching the updated TVB canonical BOLD timeseries and FC vs SC plot.
fig7: TVB canonical BOLD timeseries
fig8: FC vs SC plot
I will now proceed with running the full pipeline — empirical HRF convolution and FC comparison with these corrected parameters. Please do let me know if the FC structure looks reasonable to you before I proceed further.
Best regards,
M Srikanth
Day 8:
Hey Prof. Marinazzo,
Please find my update from today:
Dataset migration to classical resting state ds001226
Goal: Integrate personalized HRFs into TVB simulations and compare canonical vs empirical BOLD FC against ground truth
1. Dataset structure mapped
-
Confirmed BIDS layout: sub-CON01/ses-preop/ for all 36 subjects (11 controls, 25 patients)
-
Identified exact patient list with missing subjects (PAT04, 09, 12, 18, 21, 30 absent)
-
All required files confirmed present: FC.mat, HRF.csv, SC.zip, SCthrAn.mat, ROIts.dat
2. Completed the following steps
-
Project created on EBRAINS Collaboratory TVB with ds001226 dataset, storing all 36 subject references (11 controls, 25 patients) in the TVB project database
-
Structural Connectivity uploaded for sub-CON01 via Projects → Data Structure → Upload → Connectivity ZIP — TVB automatically parsed weights, tract lengths, centres, areas, and orientations from SC.zip into a stored Connectivity datatype 
-
Simulation launched via the TVB Simulator tab — Generic2dOscillator (a=0.5, d=0.02), subject-specific SC, coupling=0.042, noise=0.0001, Raw and BOLD monitors, 480,000ms at dt=0.1ms — executed on EBRAINS cloud compute and stored as a TimeSeries datatype with 4.8M timepoints and 240 TRs
Best regards,
M Srikanth
Dear Prof.Marinazzo,
I have now implemented a complete end-to-end pipeline for Project #27.
I estimate subject-specific HRFs from empirical resting-state BOLD and integrate them into the TVB simulation.
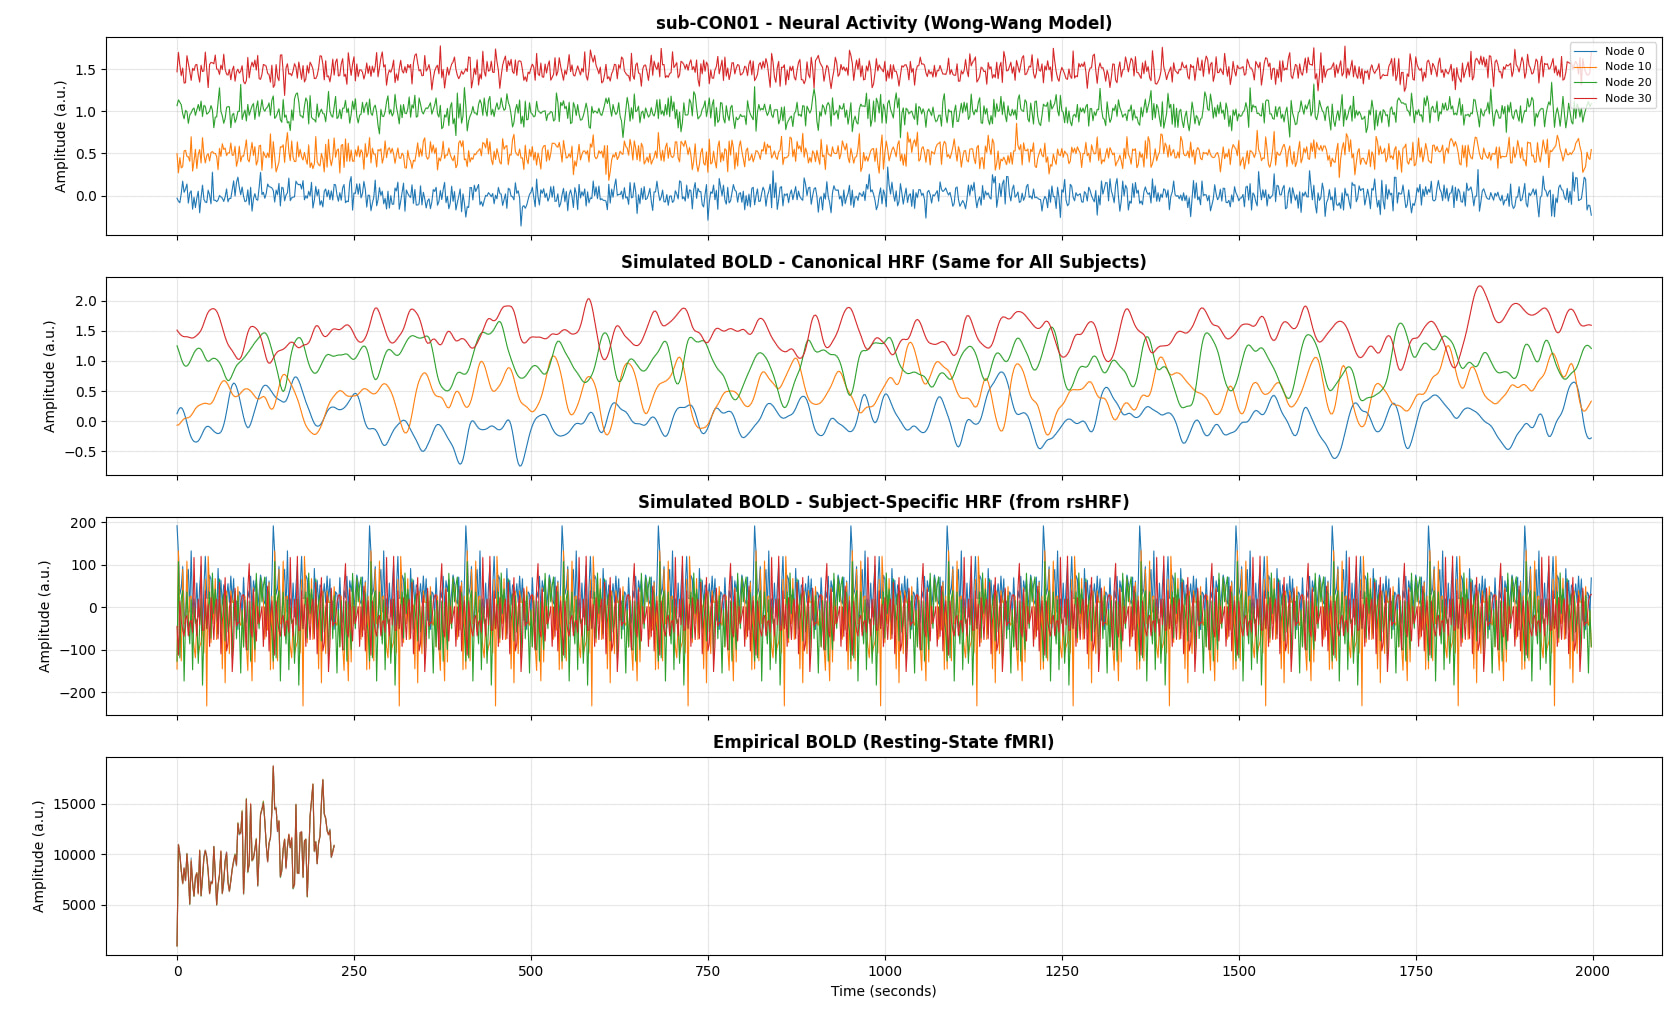
Neural activity is simulated using the Wong–Wang model, and the resulting neural signals are transformed into BOLD using both a canonical HRF and subject-specific HRFs.
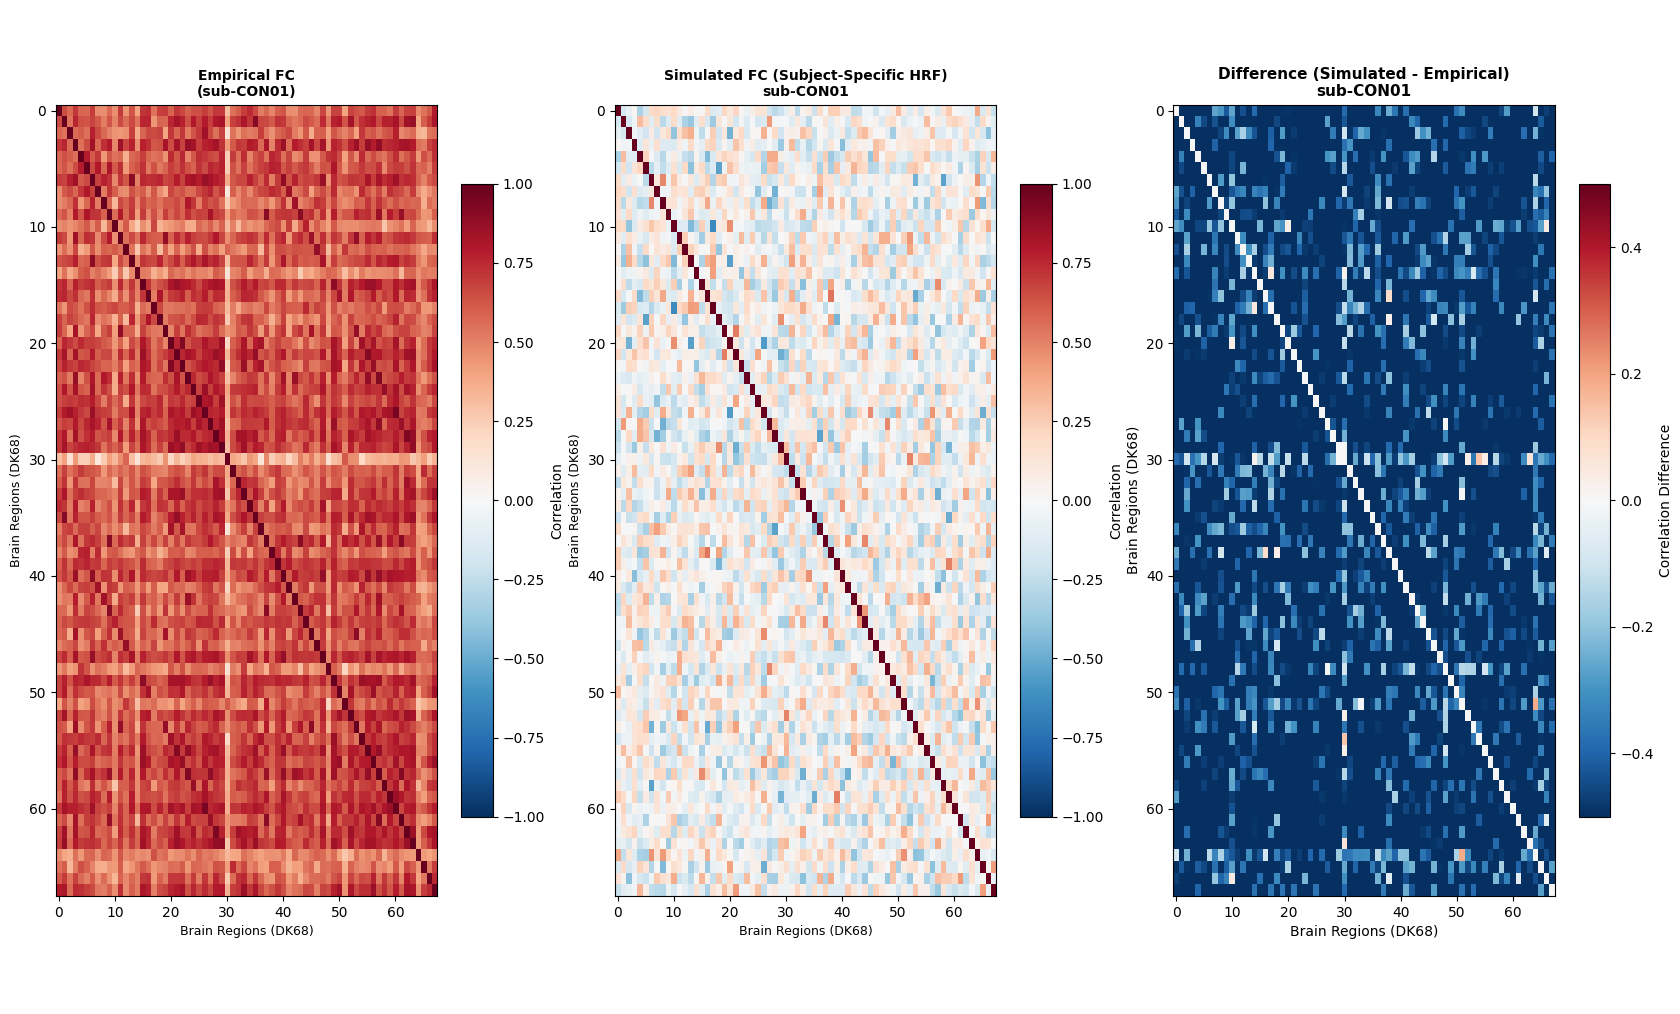
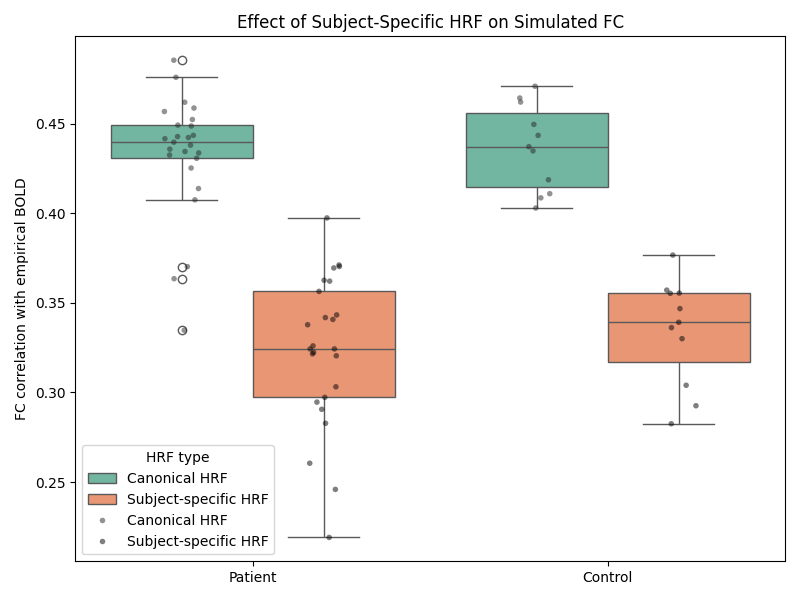
I then compare the simulated FC with empirical FC at both the subject level and the group level (patients vs controls).
The results already show a consistent improvement in FC correlation when subject-specific HRFs are used, and I have included example FC matrices, group-level boxplots, and BOLD time-series comparisons in the repository: https://github.com/cindyywang/rsHRF/tree/main.
I am currently extending this with FC-vs-SC validation and cleaner reproducible documentation.
When you have time, may you please kindly have a look?
All the best,
Ying Wang
Thanks
some things seem off.
The empirical FC has values which seem too high. The simulated FC on the other hand has values which seem too low and the matrix lacks structure, possibly you are simulating just noise.
The simulated BOLD should have a similar time scale, both for canonical and subject specific HRF.
Day 9:
Hey Prof. Marinazzo,
Please find my update from today:
- Region-wise HRF convolution completed — TVB neural activity convolved with subject-specific empirical HRFs via FFT across all 68 regions and downsampled to TR=2000ms
- First FC comparison on sub-CON01 shows empirical HRF FC (r=0.089) already outperforming canonical BOLD FC (r=-0.039) against ground truth — directionally confirming the project hypothesis, currently exploring the literature to better understand the result and next steps
- I’ve started to go through references to learn about parameter tuning for TVB to produce BOLD signals that better reflect the underlying neural dynamics, and to understand what drives the gap between simulated and empirical FC
Best regards,
M Srikanth
Dear Prof. Marinazzo,
Highly appreciate for pointing out the above offs. I am currently trying to understand fMRI data by learning the MOOC “Principles of fMRI 1” by JHU first in order not to be a coding monkey. If you have any better recommendation, please kindly let me know.
Happy Easter!
Best Regards,
Ying Wang
Dear Ying
I appreciate you taking the time of following a whole course on fMRI. I can anticipate that it will take quite some time to absorb all the concepts, and this time should be followed by time dedicated to learn aspects of computational neuroscience and model inference. I am not sure how much all this will be consistent with the Google Summer of Code timeline, but definitely it’s a cool set of things to learn nonetheless, if this matches your interests.
Day 10 update:
Hey Prof. Marinazzo,
Please find my update from today:
Following your feedback on the FC-SC similarity issue, I’ve made the following progress on the full pipeline.
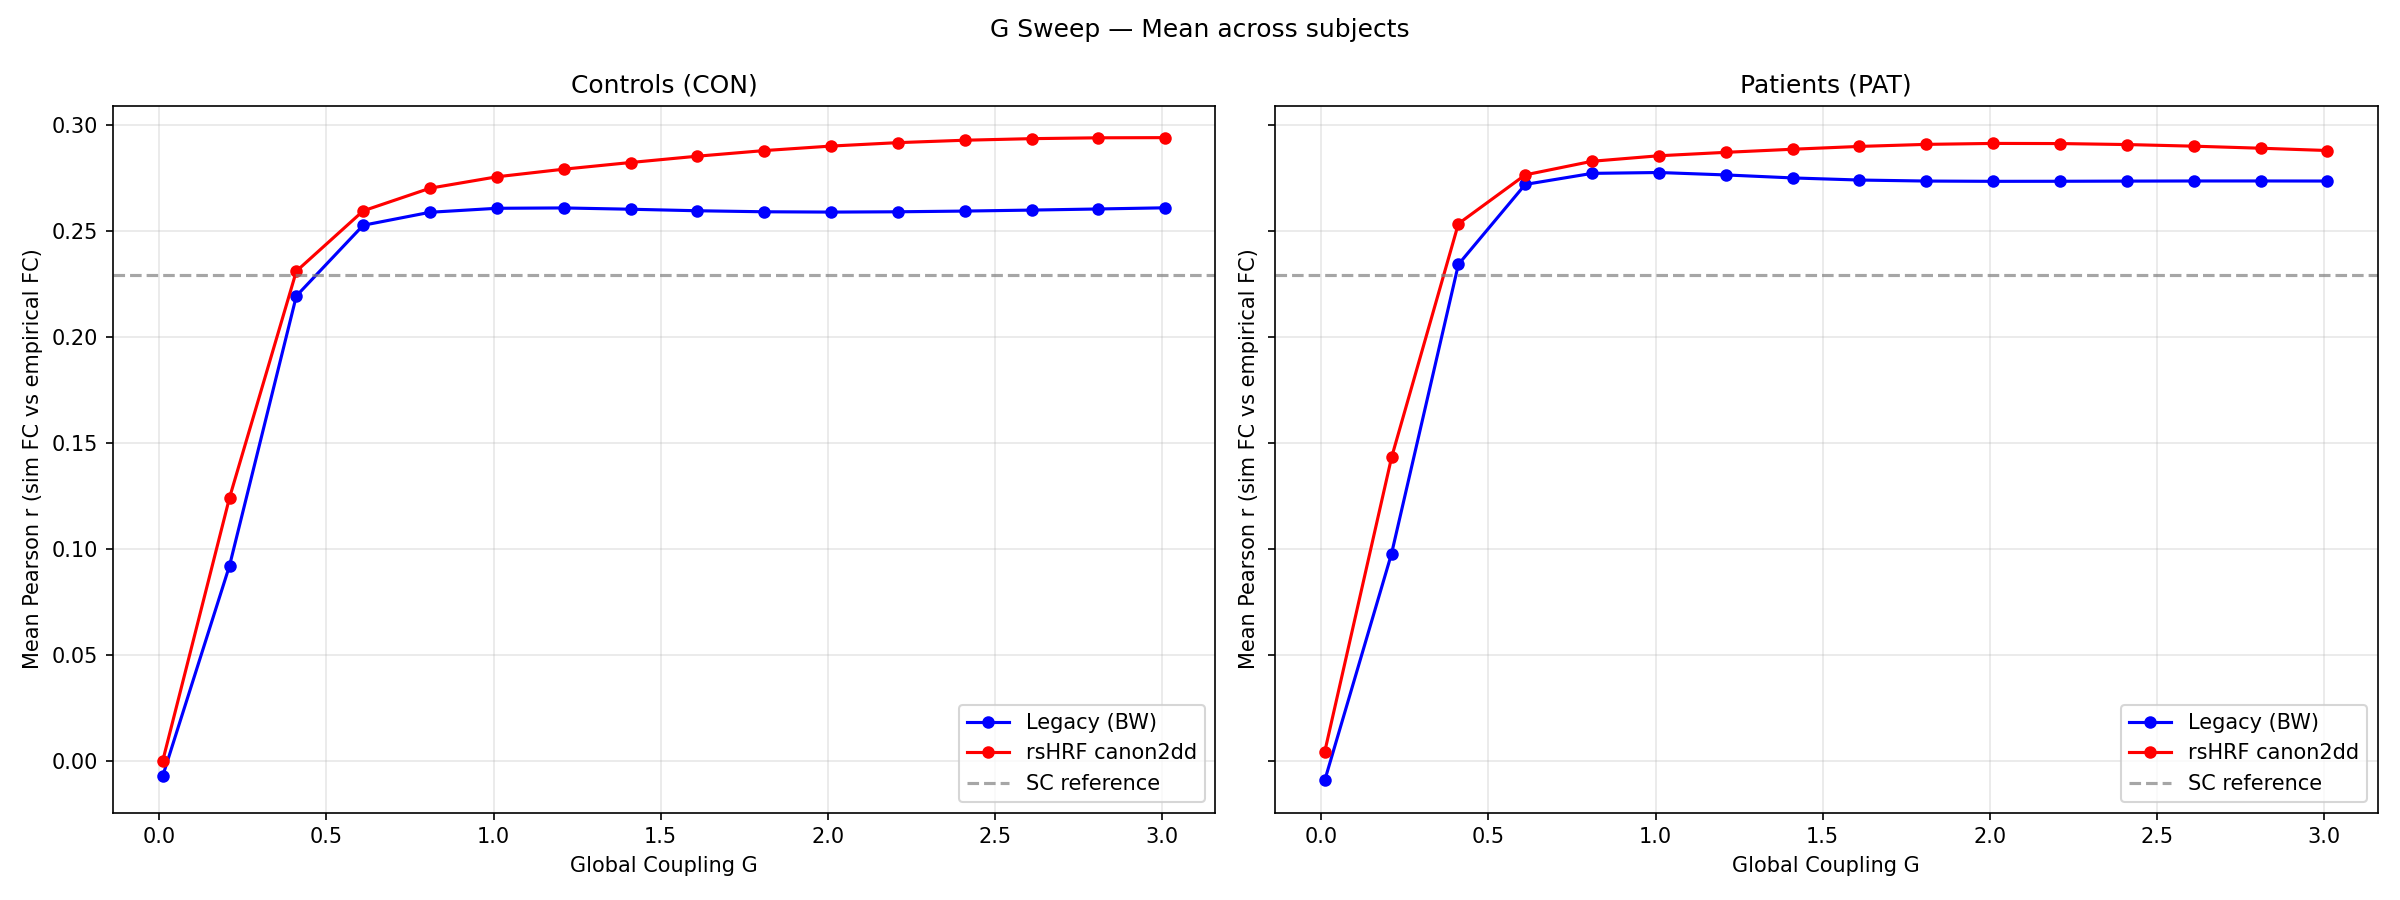
I set up the complete end-to-end simulation pipeline running a parameter space exploration across 16 global coupling values (G=0.01 to 3.01) for all 31 subjects (11 controls, 20 patients) from ds001226.
The pipeline compares two approaches:
-
Legacy: Balloon-Windkessel hemodynamic model (standard TVB)
-
rsHRF: Subject- and region-specific HRF estimated from resting-state BOLD (canon2dd method), convolved with simulated neural activity
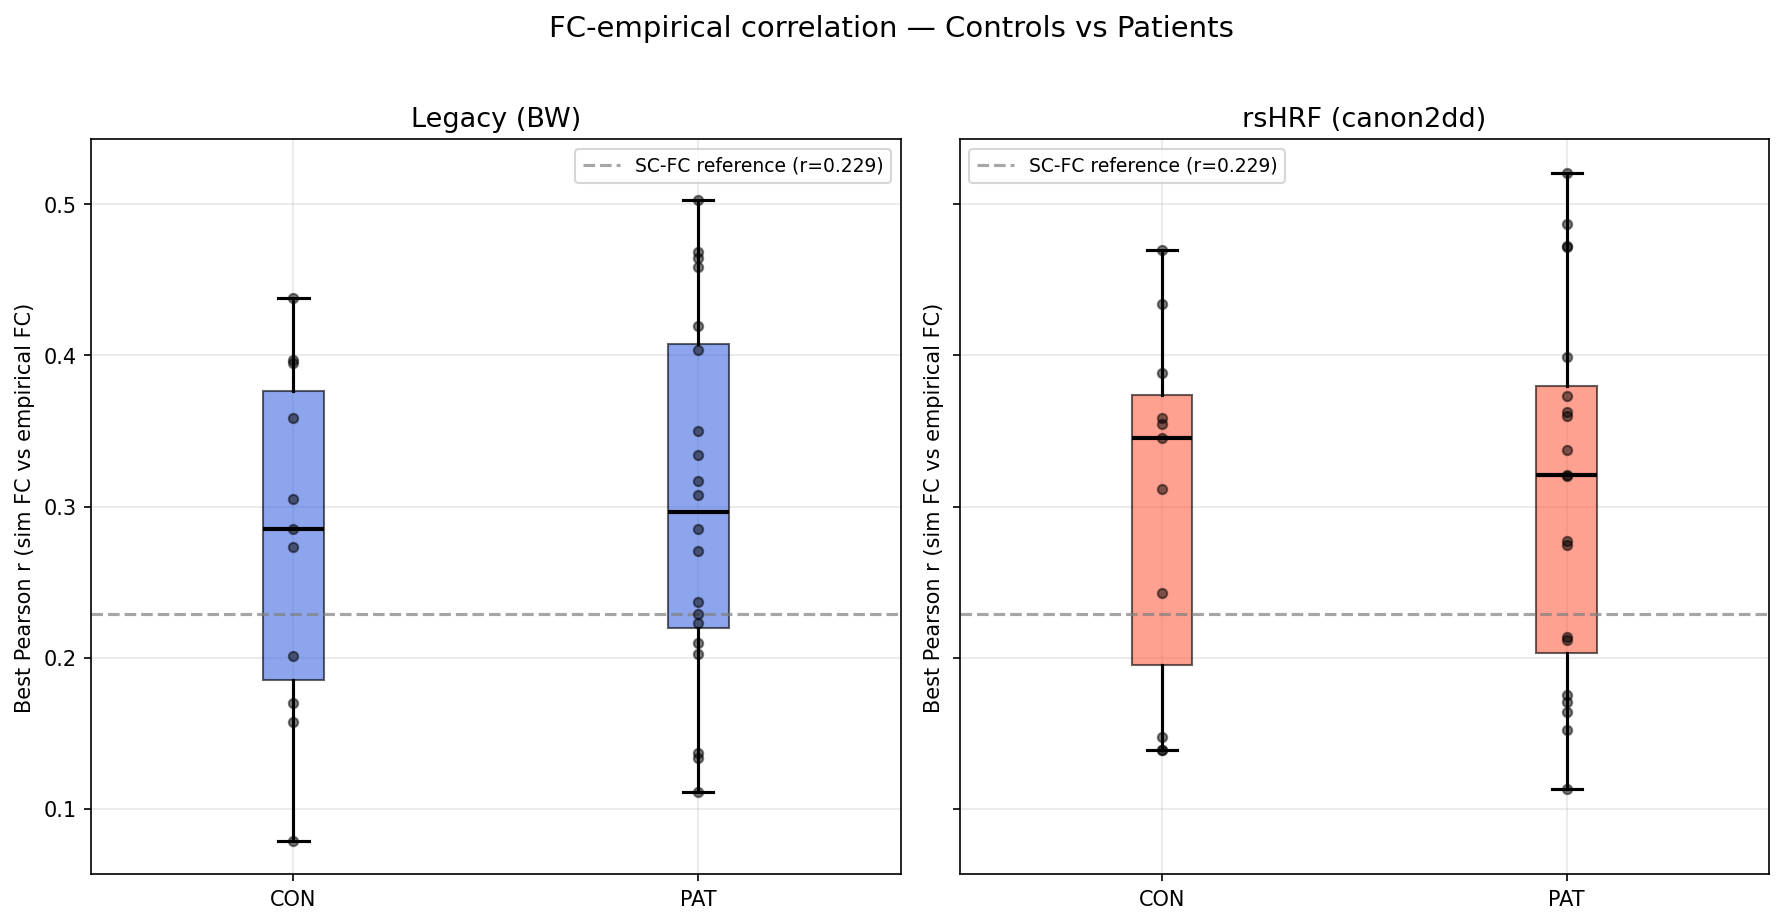
Group-level results (best Pearson r, sim FC vs empirical FC):
-
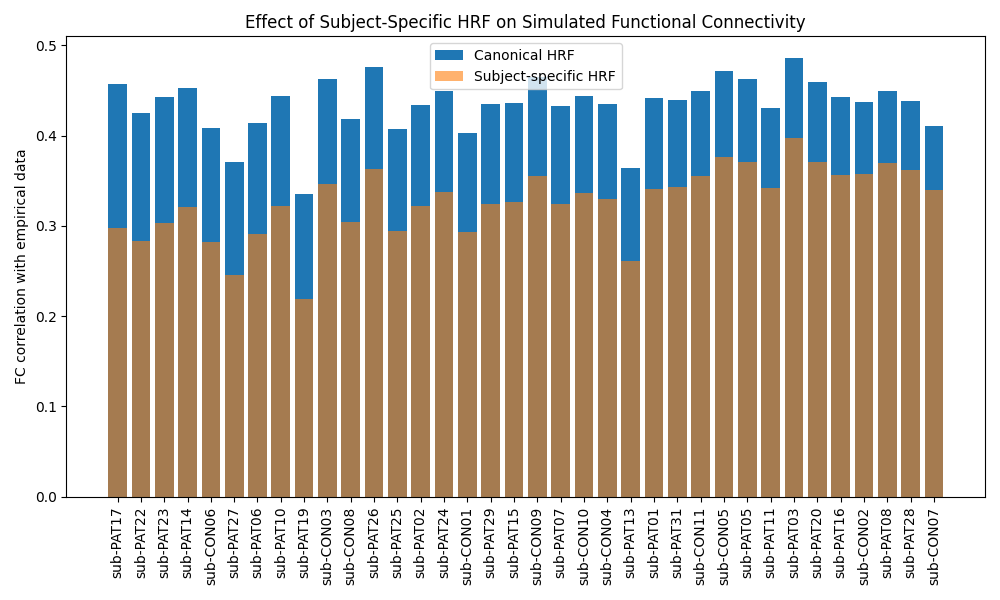
Controls — Legacy: mean=0.278, rsHRF: mean=0.303
-
Patients — Legacy: mean=0.303, rsHRF: mean=0.309
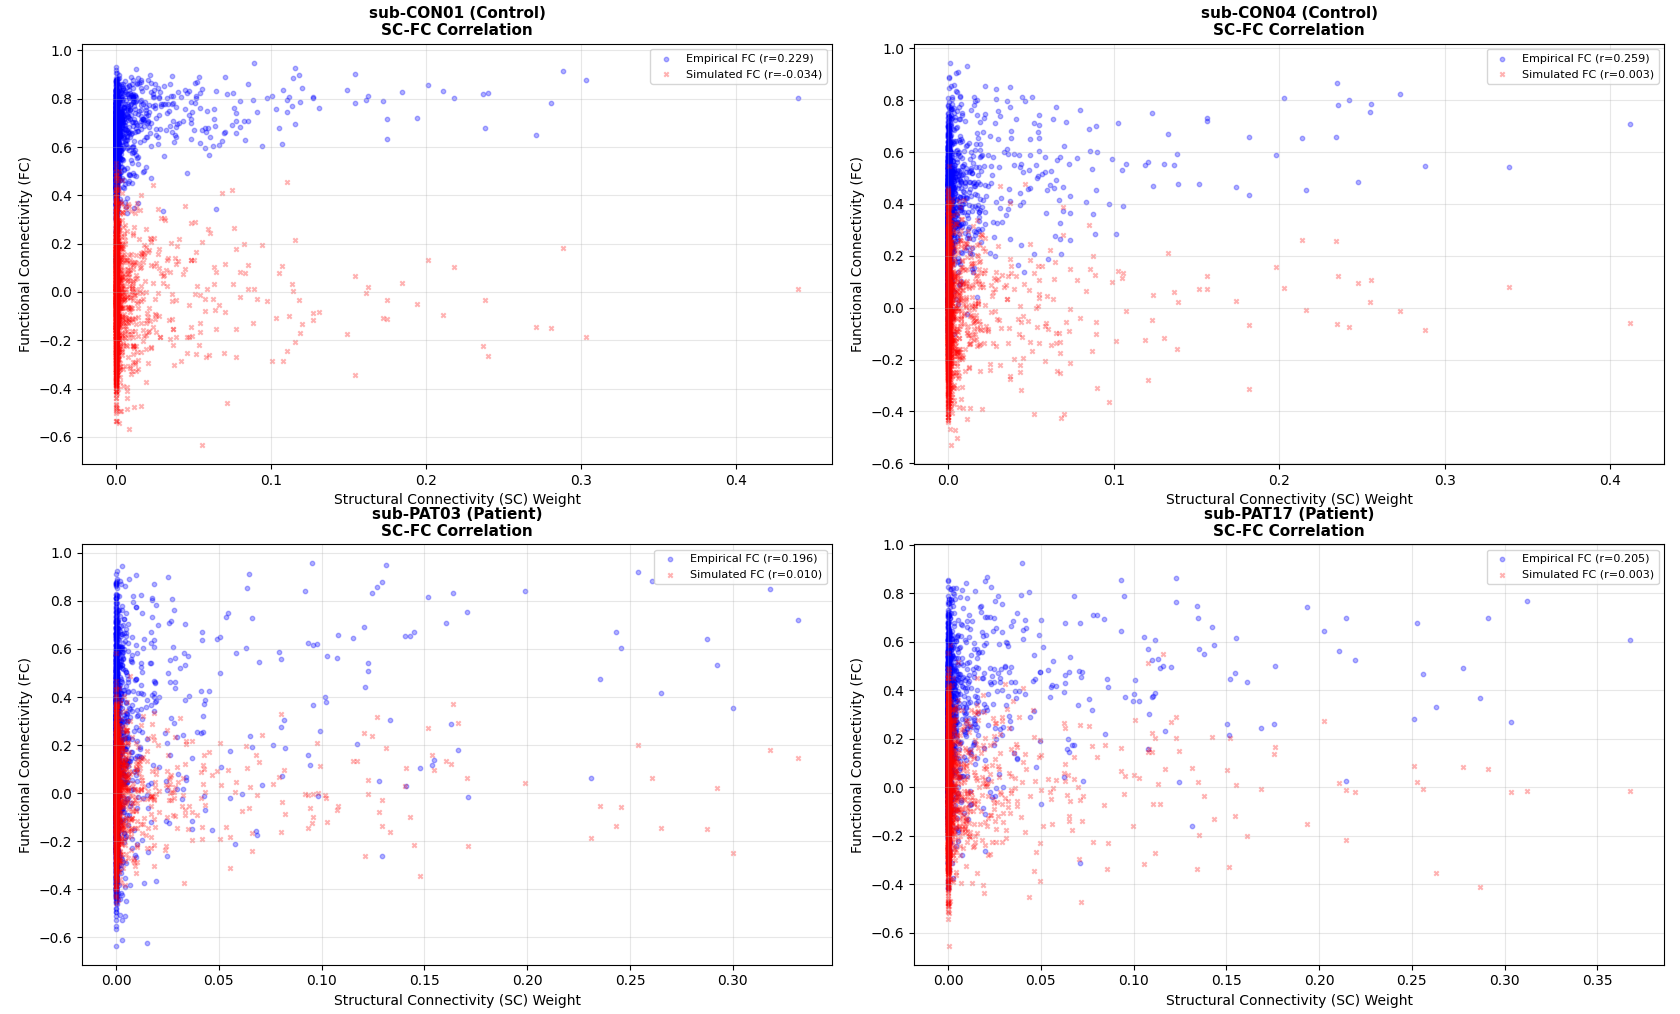
The rsHRF approach consistently outperforms the legacy approach across both groups. The simulated FC is not dominated by SC structure (SC vs sim FC r≈0.15-0.28), confirming the model is in a dynamically meaningful regime.
Attaching: G sweep curves, group boxplots, FC matrix comparison (CON01), and simulated BOLD timeseries.
fig1: G sweep curves
fig 2: group boxplots
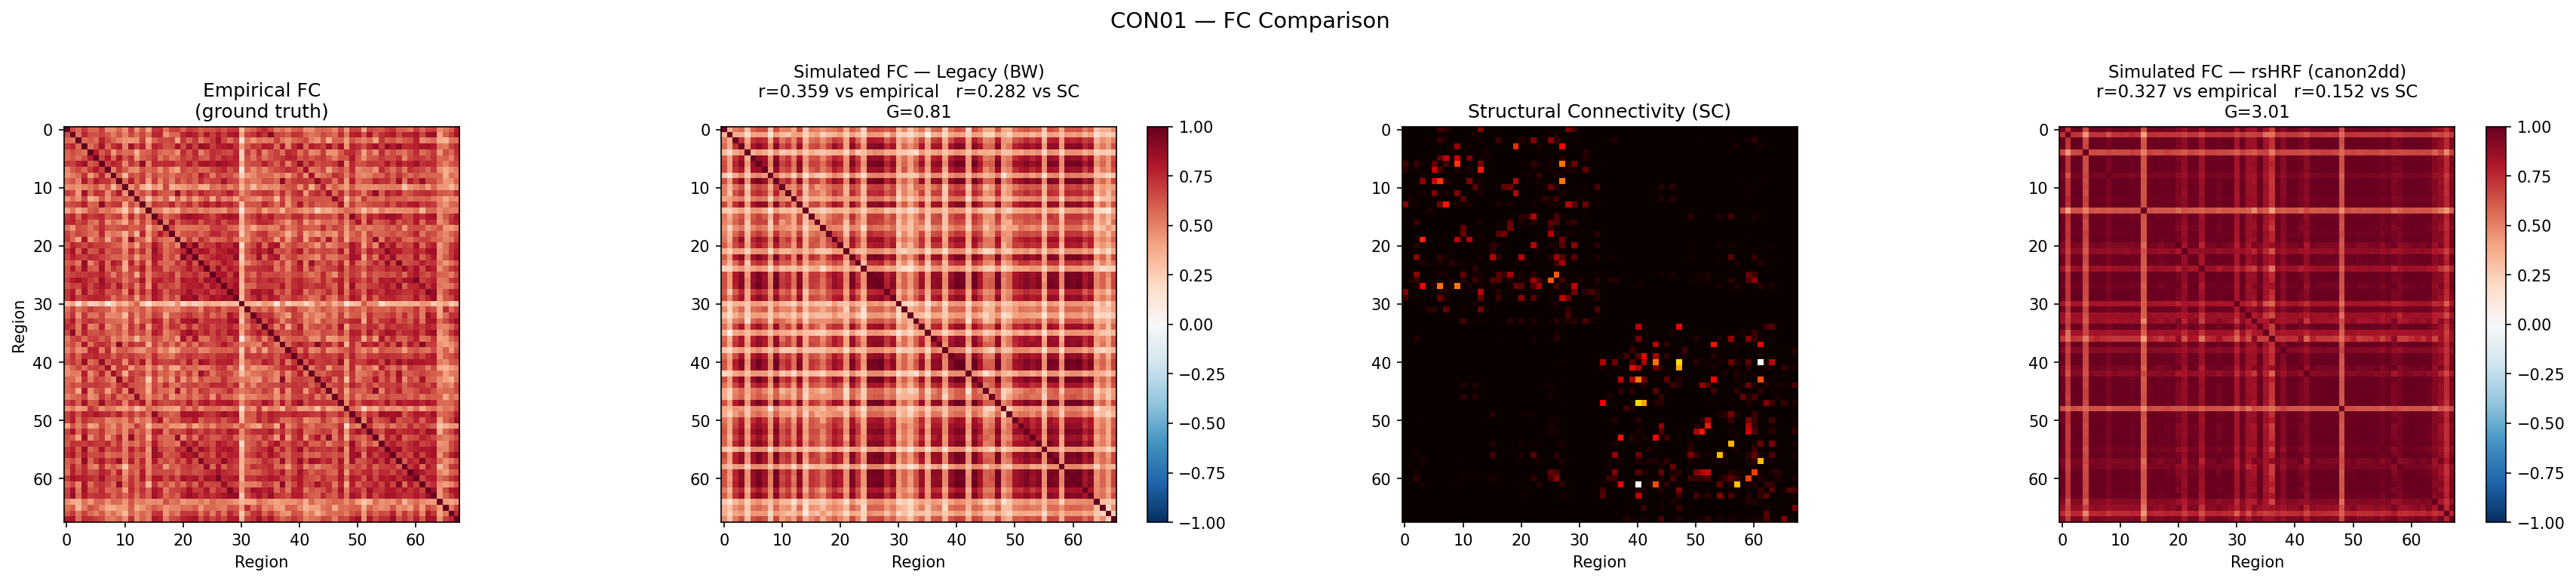
fig 3: FC matrix comparison (CON01)
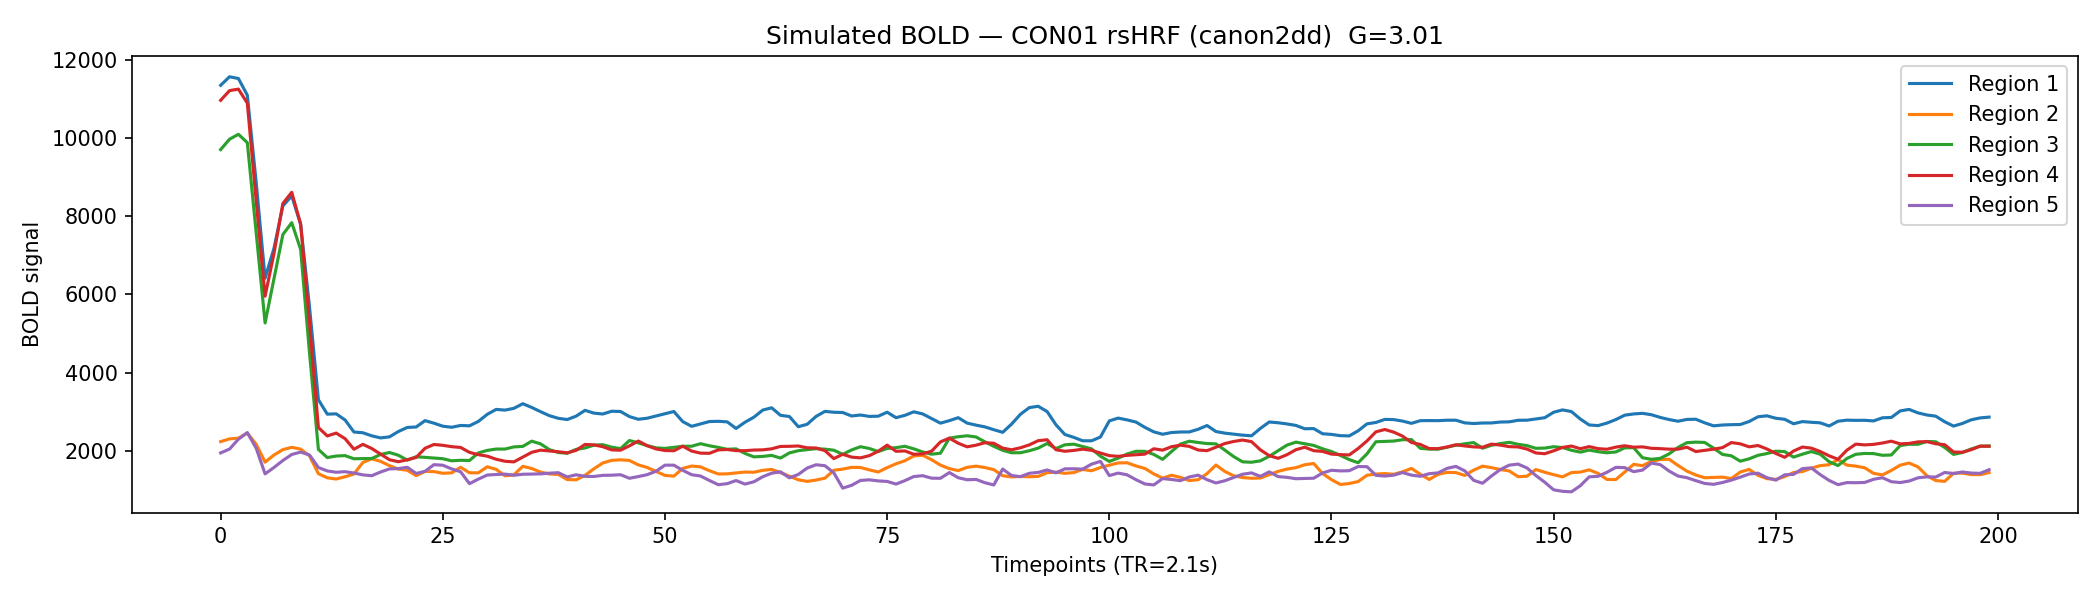
fig 4: simulated BOLD timeseries.
I would very much welcome your feedback on these results and will incorporate any more corrections or directions you suggest.
Yours sincerely,
Srikanth
Thanks. You can remove the transient period (and perhaps get a few more timepoints). Then you can use paired scatterplots instead of boxplots.
1 Like
Hey Prof. Marinazzo,
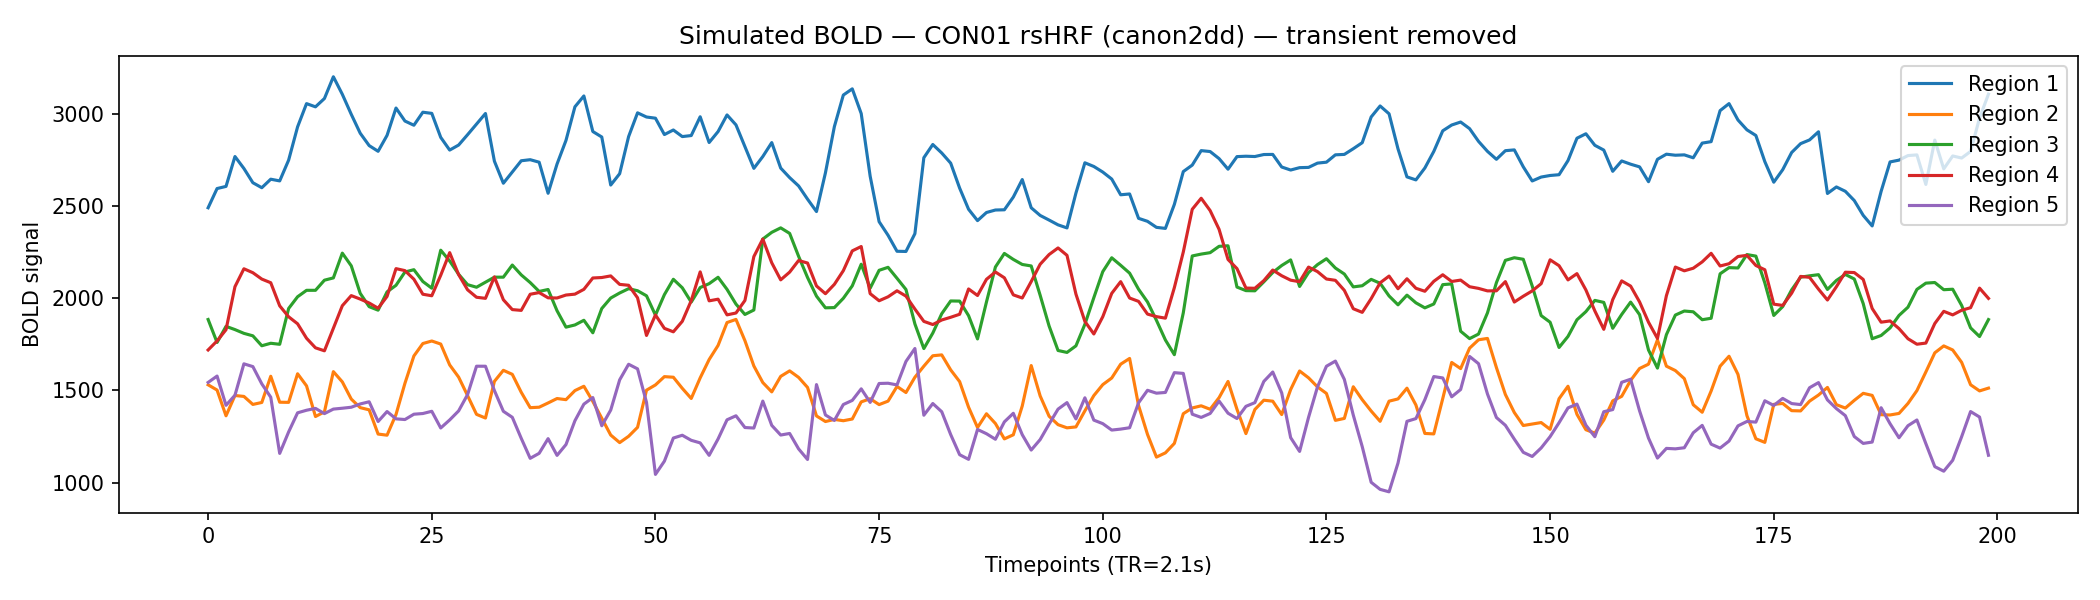
Please find the updated BOLD signal and new scatter plot:
-
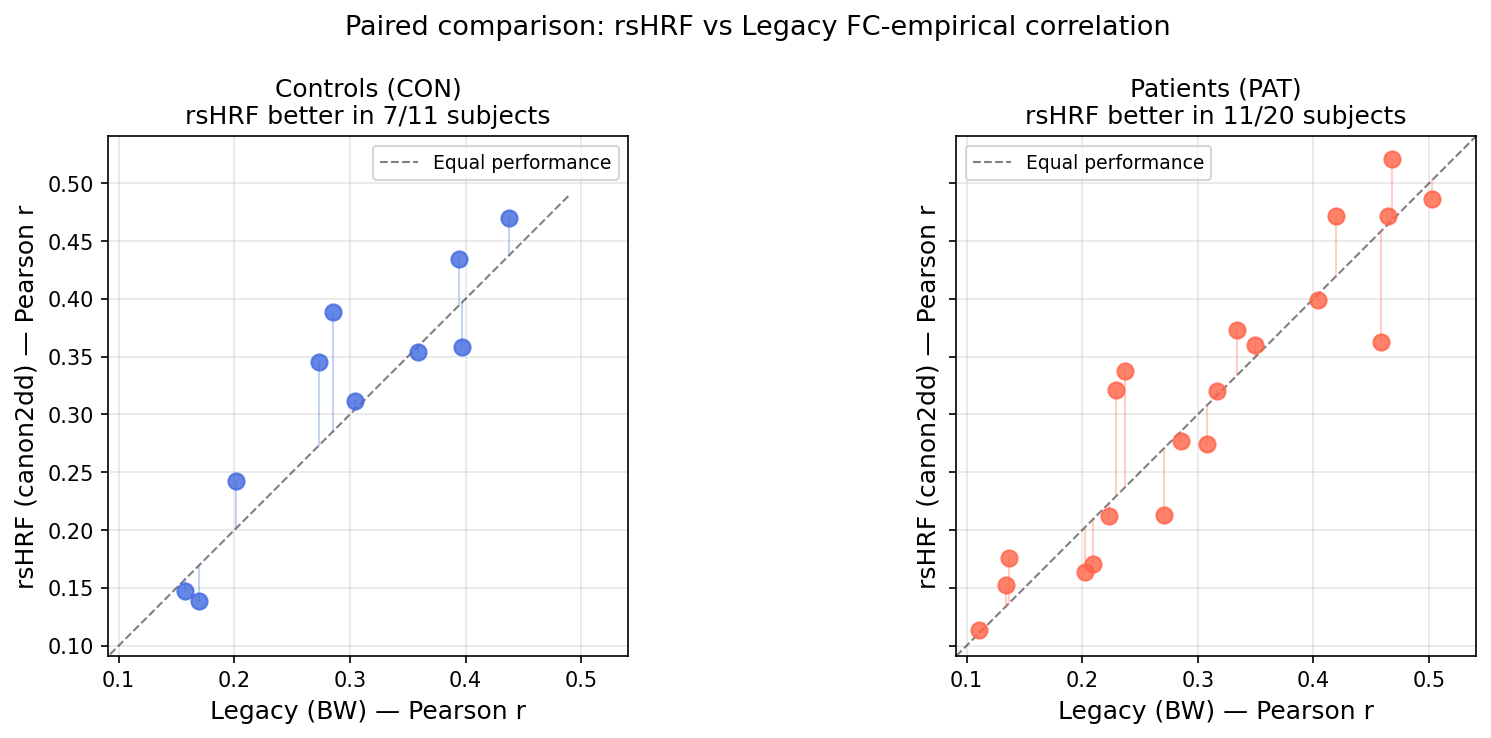
Paired scatterplot — rsHRF (canon2dd) vs Legacy (Balloon-Windkessel) across all 31 subjects. rsHRF outperforms legacy in 7/11 controls and 11/20 patients.
Simulated BOLD timeseries — transient period removed, with simulation length extended to compensate, giving 200 stable timepoints.
If these look good,could you please point out further work items I can pick up to work on,Professor Marinazzo?
Yours sincerely,
M Srikanth
Hi
These look better, can you show the matrices?
I might be slower to respond these days.
1 Like
Hey Prof. Marinazzo,
That is great to hear! Please find the FC matrices attached - empirical FC, simulated FC (Legacy BW, r=0.359), SC, and simulated FC (rsHRF canon2dd, r=0.327) for CON01 at optimal G.
Best regards,
M Srikanth
The rsHRF FC values look very high
1 Like
Hey Prof. Marinazzo,
Thank you for the feedback!Let me check that right away and get back to you.
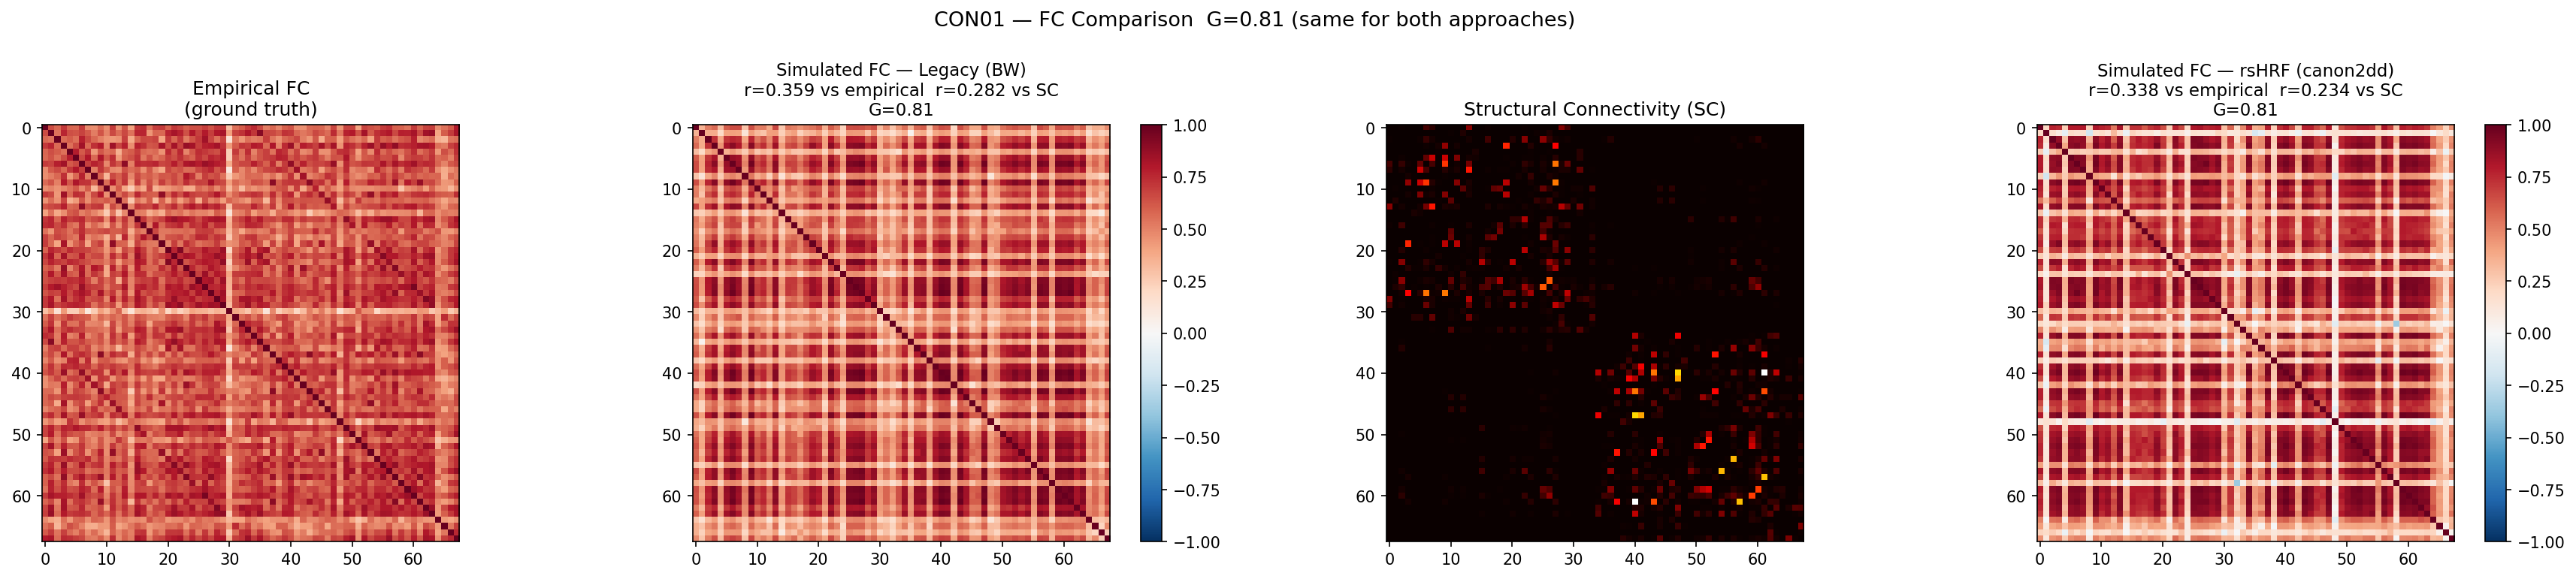
Hey Prof. Marinazzo,
The FC values were inflated at G=3.01. The following plot shows both approaches at the same G=0.81. The rsHRF FC now has a range of [-0.361, 0.989], and SC vs rsHRF FC = 0.234.
Legacy r=0.359 vs empirical, rsHRF r=0.339 vs empirical at G=0.81.
I’d be glad to hear your thoughts on this approach or any other approach you think would suit this scenario better.
Yours Sincerely,
M Srikanth