Mentor: Daniele Marinazzo <daniele.marinazzo@gmail.com>
Skill level: Intermediate to Advanced
Required skills: Python, Docker; familiarity with neuroimaging tools (AFNI, FSL, FreeSurfer) would be beneficial
Time commitment: Full time (350 hours)
About: Statistical dependencies (Functional Connectivity, FC) between BOLD time series from different brain regions in fMRI experiments are modulated by the relative delays in blood arrival time in these regions. This crucial aspect has been mostly overlooked in empirical studies, and completely overlooked in computational models of large scale BOLD activity, where (neuronal transmission) delays play a crucial role, such as The Virtual Brain. Delays in blood arrival time can be estimated using a tool called Rapidtide, which allows also to estimate and regress systemic low frequency oscillations (sLFOs).
Aims: This project will have the aim to include blood arrival time delays in computational models of brain activity with TVB in EBRAINS, and to compare the results with those obtained with the legacy approach with no blood arrival time delays.
Websites: Rapidtide — rapidtide 3.1.8 documentation, The Virtual Brain | EBRAINS
Tech keywords: Python, Docker, The Virtual Brain, rapidtide, sLFOs
Title: GSoC 2026 Project #28 - Pre-application prototype: blood arrival time × TVB pipeline
Hi Prof. Marinazzo,
I’ve been working on a prototype pipeline for this project and wanted to share what I found before submitting a formal proposal.
The core question I tried to answer: if you run TVB with and without blood arrival time delays, how different are the resulting FC matrices, and is the difference spatially structured? I used rapidtide on a subject from OpenNeuro ds000228 to get a real delay map, parcellated it into 100 Schaefer regions, and then ran two parallel analyses - one empirical (shifting BOLD time series before correlating) and one in simulation (injecting per-region HRF onset delays and a Balloon-Windkessel implementation).
A few results that came out of this:
The delay range across regions is 2.2 seconds (-2.97s to -0.78s), which is large enough to matter for FC. In the empirical analysis the Spearman correlation between inter-regional delay difference and |ΔFC| is slightly negative (ρ = -0.062), but I think this is a TR discretization artefact rather than a real finding. At TR=2s, all delays collapse to just two integer shifts (0 or -1 sample), and the pairs that get the maximum relative displacement happen to be those with the smallest absolute delay differences, which inverts the sign. At 1ms simulation resolution the relationship flips positive and becomes very strong (ρ = 0.396, p < 10⁻¹⁸⁵).
The mean |ΔFC| in the HRF simulation is 0.0148 versus 0.0023 empirically, about 6× larger - which suggests TR-level analyses systematically underestimate the true bias.
At the network level, Cont and Default networks show the widest delay spread, and the Limbic × Cont pair has the highest mean |ΔFC| (0.023) across all 21 network pairs. I’m not sure whether this is a genuine vascular anatomy result or an artefact of the small Limbic network (only 5 regions), so I’d be curious whether you’ve seen anything similar in your rapidtide analyses.
The full pipeline and figures are here: [GITHUB_URL]
I have two questions before I write a proposal:
-
The negative empirical ρ - do you think the sign inversion is purely the TR discretization I described, or could there be a vascular architecture reason why region pairs near the shift boundary (around -1s delay) tend to be more functionally connected and thus show larger raw |ΔFC| for other reasons?
-
For the GSoC implementation in TVB, is the intended integration point the Bold monitor’s hemodynamic state equations directly, or would a preprocessing step that modifies the effective connectivity delays before simulation be more appropriate architecturally?
Happy to share any of the intermediate outputs if useful.
Thanks
Ashmit Gupta
Dear Ashmit
thanks a lot for this!
rapidtide is best applied to raw data, before processing. This is because if processing includes global signal regression, or regression of other physiology-related quantities, this will distort the estimate of the lags.
It makes sense that regions sharing the same lag tend to have stronger statistical relationships.
The most used target property for TVB models is the correlation between empirical and simulated FC, and this could be the first test to do. Other, probably better, target properties exist (including local features such as time series spectra and excitability).
Systemic low frequency oscillations (those removed by rapidtide), inflate FC over time https://pubmed.ncbi.nlm.nih.gov/38898230/. So a TVB fit of FC inflated by sLFOs will lead to estimating modulations in neuronal activity, when it’s actually not likely the case.
Another relevant variable is the resting state hemodynamic response function https://ebrains.eu/data-tools-services/tools/rshrf. This is the object of another GSoC project, for the moment you can go ahead with rapidtide. The final pipeline should ideally include this step (to be performed after rapidtide and after processing).
All the best
Thanks!
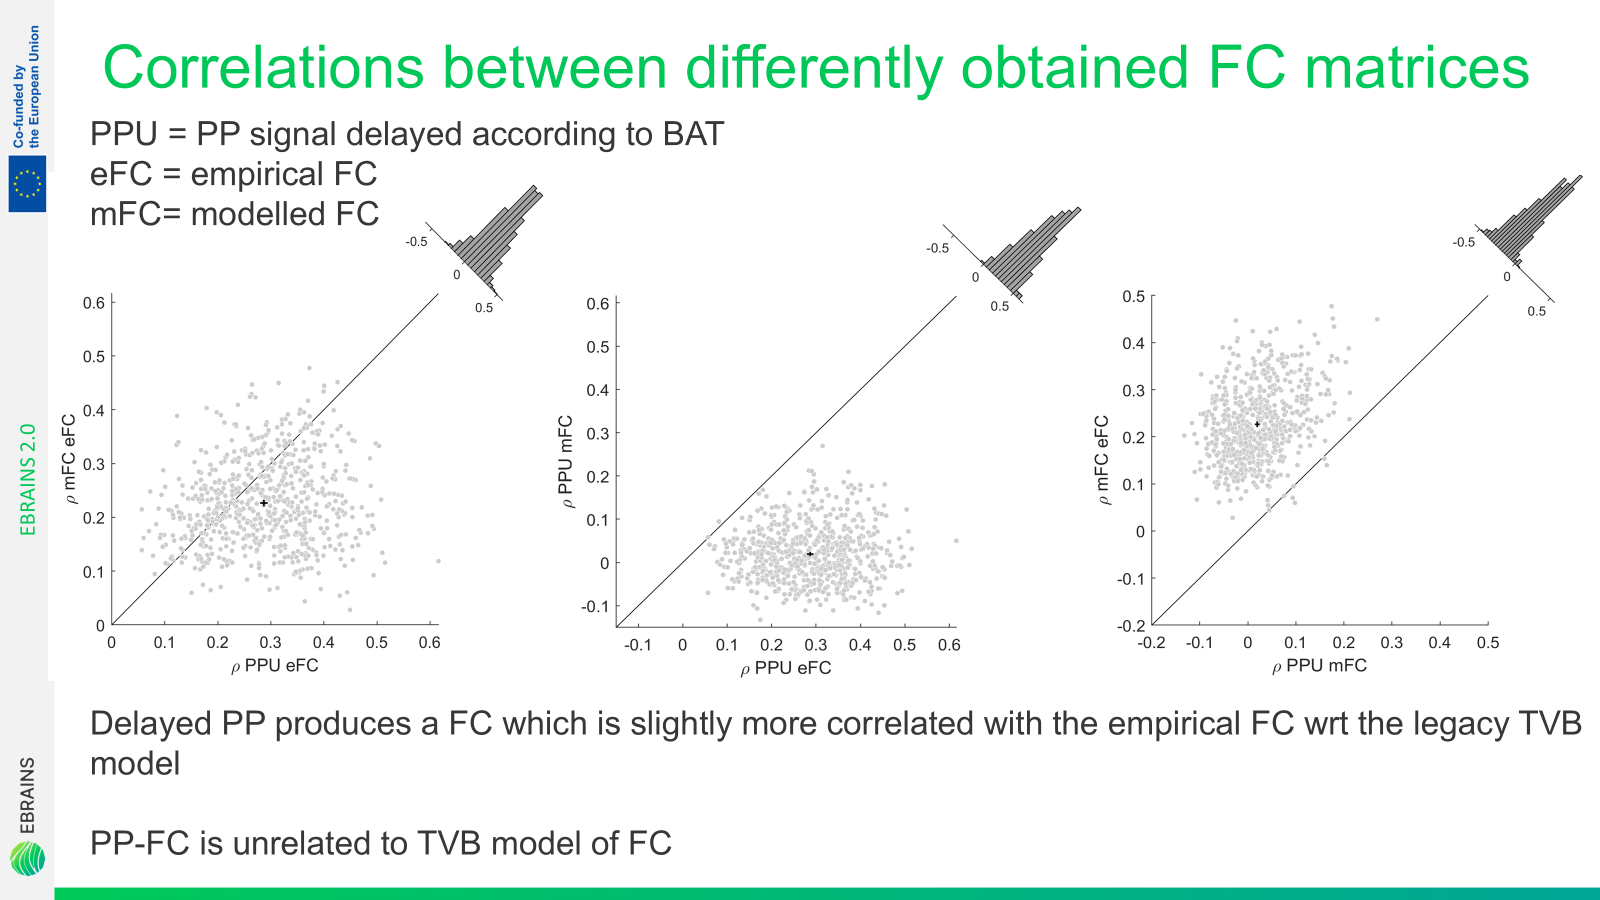
The best example of the network effect of blood arrival time is given in this paper
and in the analysis I made and reported below, showing that blood arrival time alone can give e fit with the empirical FC equally good if not slightly better than TVB.
On the other hand neuronal modeling and vascular delays provide independent contributions in predicting the empirical FC. This simply means that all these factors contribute, in a complementary way. And there definitely is a (causal) link between plumbing and neuronal activity in the brain. Still, modulations to FC are certainly also due to modulations in vascularization.
The core question of the project, rather than “how is FC changed?”, which we know already, is “how do neural parameters estimated by TVB fitting change when the target empirical FC matrix is obtained after correcting for systemic low frequency oscillations and blood arrival time?”.