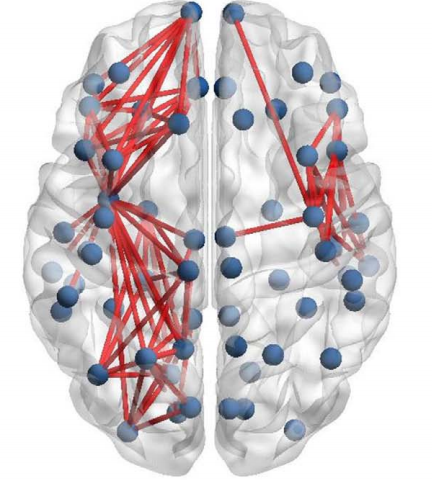
I am following a paper to calculate functional connectivity of difference between MDD (major depressive disorder group) and Control group. I am getting more connectivity in MDD as compared to control group in certain frequency bands. The paper after calculating binary matrix and plotting it in 3D is getting region specific connections (like it is noticeable that left central, left parietal-occipital regions etc. is having more connections) and proceeding it further by narrowing down interests on these specific regions.
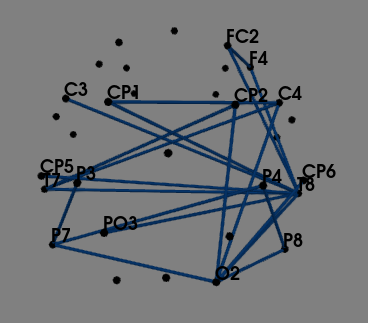
I am stuck at this level, as I’m not getting region specific connectivity infact I’m getting inter-hemisphere connections. Please guide how to continue this further.
I’m using mne (Python) to code.
Algorithm:
- I’ve calculated phase synchronization between two signals using PLI for both groups and created adjacency matrices for both. Then I’ve converted both adjacency matrix to binary matrix using a threshold. (Manually setting threshold to higher value for clearer graph)
- Then calculating difference matrix between both binarized matrices using absolute(difference)
- Finally, Plotting that difference matrix using plot_sensors_connectivity() function
Ideally, should the difference matrix absolute(MDD-control) be region specific like in paper or have inter-hemisphere connections as well? If region-specific, what might be reason for my plot connectivity?
Note: This is plotted using a resting state eye open EEG data (32 channels). And both these graphs are for a specific frequency band.

