Hi everyone,
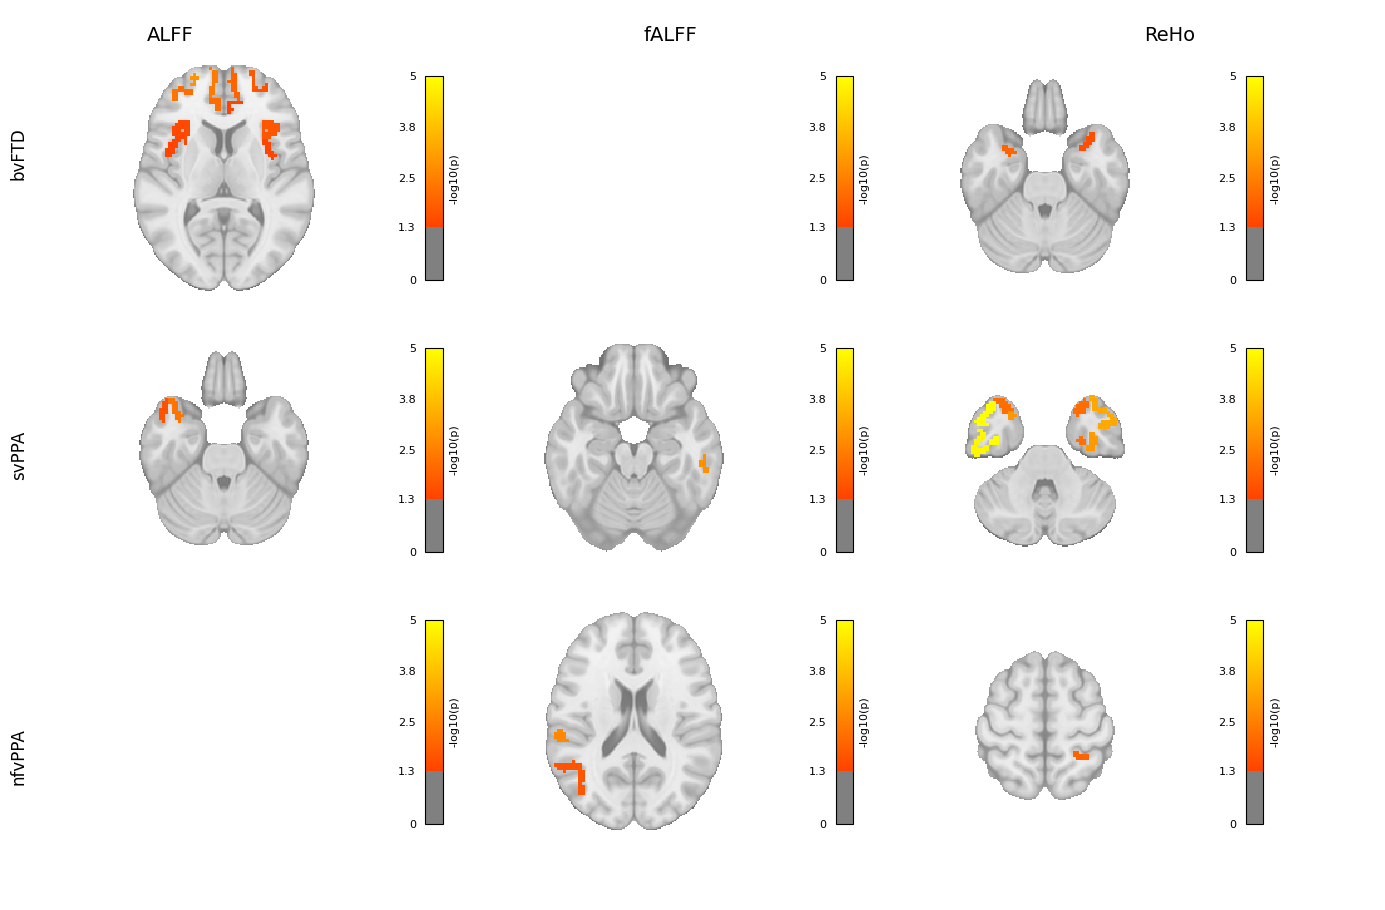
I’m working on visualizing brain regions associated with different subtypes and metrics using Nilearn. The visualization works well for regions with matches, but for those without matches, the output shows a black background.
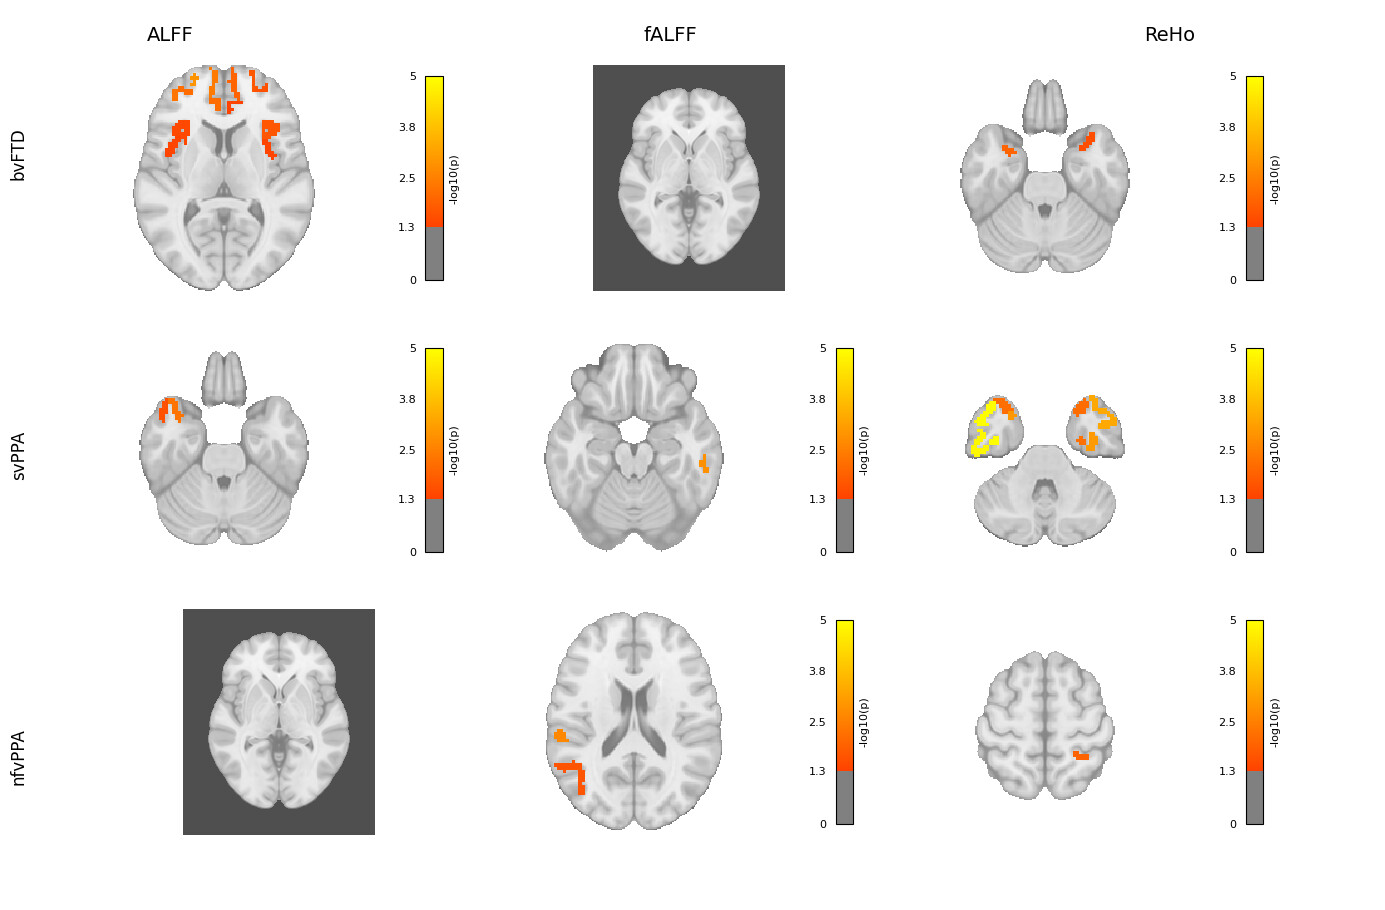
I’ve attached the code I used with Nilearn. Could anyone please help me understand why this is happening and how to fix it?
import matplotlib.pyplot as plt
from nilearn import plotting, image, datasets
import pandas as pd
import nibabel as nib
import numpy as np
from nilearn.image import new_img_like

# === Load Gordon atlas and labels ===
atlas_path = "/content/atlas-Gordon_space-MNI152NLin2009cAsym_dseg.nii.gz"
labels_path = "/content/atlas-Gordon_dseg.tsv"
atlas_img = nib.load(atlas_path)
labels_df = pd.read_csv(labels_path, sep='\t')

# === File mapping: metric → CSV file ===
data_files = {
    "ALFF": "/content/ALFF_control_comparisons_FWE.csv",
    "fALFF": "/content/fALFF_control_comparisons_FWE.csv",
    "ReHo": "/content/REHO_control_comparisons_FWE.csv"
}

# === Subtype mapping ===
subtype_mapping = {
    "ALFF": ["bvFTD", "svFTD", "pnfa"],
    "fALFF": ["bv", "sv", "pnfa"],
    "ReHo": ["bvFTD", "svFTD", "pnfa"]
}

# === Display names for rows ===
group_display_names = {
    "bvFTD": "bvFTD",
    "svFTD": "svPPA",
    "pnfa": "nfvPPA",
    "bv": "bvFTD",
    "sv": "svPPA"
}

# === Load background template ===
mni_template = datasets.load_mni152_template()

# === Create white-background figure ===
plt.style.use('default')
fig, axes = plt.subplots(3, len(data_files), figsize=(15, 10), facecolor='white',
                         subplot_kw={'xticks': [], 'yticks': []})
#fig.suptitle("ROI-wise Brain Alterations in FTD Subtypes Compared to Controls Across rs-fMRI Metrics\n(-log10 of FWE-corrected p-values)", fontsize=14)

# === Column titles ===
#for col, metric in enumerate(data_files.keys()):
    #axes[0, col].set_title(metric, fontsize=12, pad=20)

column_titles = list(data_files.keys())
n_cols = len(column_titles)

for i, title in enumerate(column_titles):
    xpos = (i + 0.5) / n_cols  # center over each column
    fig.text(xpos, 0.90, title, ha='center', va='bottom', fontsize=14)

# === Row labels ===
for row, code in enumerate(["bvFTD", "svFTD", "pnfa"]):
    label = group_display_names[code]
    axes[row, 0].annotate(label, xy=(0, 0.5), xytext=(-axes[row, 0].bbox.width * 0.2, 0),
                          xycoords='axes fraction', textcoords='offset points',
                          size='large', ha='right', va='center', rotation=90)

# === Plotting loop ===
for col, (metric, file_path) in enumerate(data_files.items()):
    df = pd.read_csv(file_path)
    if "FWE_corrected_p" in df.columns:
        df["neg_log10_p"] = -np.log10(df["FWE_corrected_p"].clip(lower=1e-10))

    subtype_list = subtype_mapping[metric]

    for row, subtype in enumerate(subtype_list):
        ax = axes[row, col]
        ax.set_facecolor('white')

        sub_df = df[(df["Group1"] == "control") & (df["Group2"] == subtype) & (df["Significant (FWE)"] == True)]

        # === Clean and match ROI names ===
        prefix = f"{metric.upper()}_" if metric != "fALFF" else ""
        cleaned_roi_names = [roi.replace(prefix, "") for roi in sub_df["ROI"]]
        matched = labels_df[labels_df["label"].isin(cleaned_roi_names)]

        if matched.empty:
            print(f"⚠️ No matching ROIs for: {subtype} in {metric}.")
            print("  ROI column sample:", list(sub_df["ROI"].unique())[:5])
            print("  Cleaned ROI sample:", cleaned_roi_names[:5])
            print("  Available atlas labels:", labels_df["label"].unique()[:5])
            plotting.plot_anat(
                anat_img=mni_template,
                axes=ax,
                display_mode="z",
                draw_cross=False,
                annotate=False,
                cut_coords=1,
                black_bg=False
            )
            continue

        # === Generate mask image with -log10(p) as intensity ===
        data = np.zeros(atlas_img.shape)
        for _, row_label in matched.iterrows():
            roi_idx = int(row_label["index"])
            roi_label = row_label["label"]
            p_val_row = sub_df[sub_df["ROI"].str.contains(roi_label)]
            if not p_val_row.empty:
                p_val = p_val_row["FWE_corrected_p"].values[0]
                neg_log_p = -np.log10(max(p_val, 1e-10))
                data[atlas_img.get_fdata() == roi_idx] = neg_log_p

        neglog_img = new_img_like(atlas_img, data)

        # === Plot with white background ===
        display = plotting.plot_stat_map(
            neglog_img,
            bg_img=mni_template,
            axes=ax,
            display_mode="z",
            draw_cross=False,
            cut_coords=1,
            cmap="autumn",
            annotate=False,
            threshold=1.3,
            vmax=5,
            black_bg=False,
            colorbar=True
        )

        # === Add colorbar label (safe method) ===
        fig_colorbar = display._cbar if hasattr(display, "_cbar") else None
        if fig_colorbar and hasattr(fig_colorbar, "ax"):
            fig_colorbar.ax.set_ylabel("-log10(p)", rotation=90, fontsize=8, labelpad=5)
            fig_colorbar.ax.yaxis.label.set_color("black")
            fig_colorbar.ax.tick_params(colors="black", labelsize=8)

# === Final layout ===
plt.tight_layout(rect=[0.05, 0.03, 0.98, 0.95])
plt.show()
Thank you in advance!