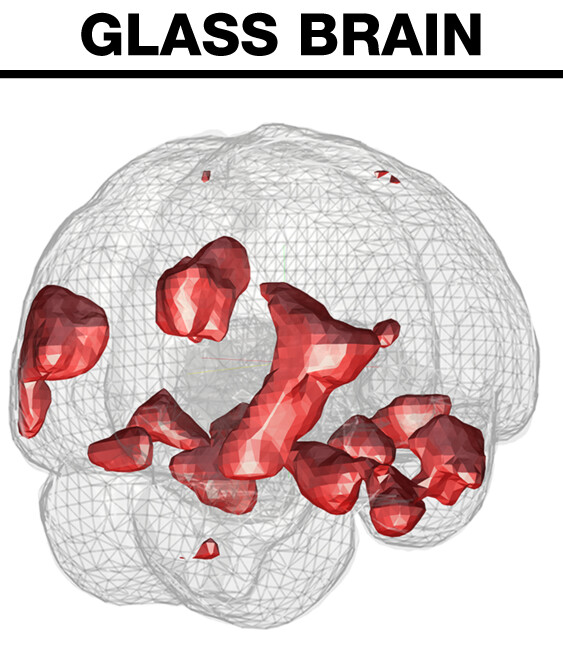
I was looking through this website: Best practice for fMRI displays, plots and colour maps and became interested on how one could create a similar plot:
It appears to be a hybrid between a glass brain and a surface plot.
I’m trying to explore possibilities of plotting subcortical statistics maps.
I tried:
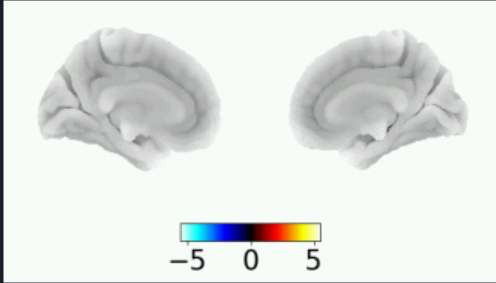
plotting.plot_img_on_surf(zmap,
views=[‘medial’],
hemispheres=[‘left’, ‘right’],
colorbar=True, bg_on_data=True, inflated=True,threshold=0.01)
But its not quite working out, can’t really see the Hippocampus…
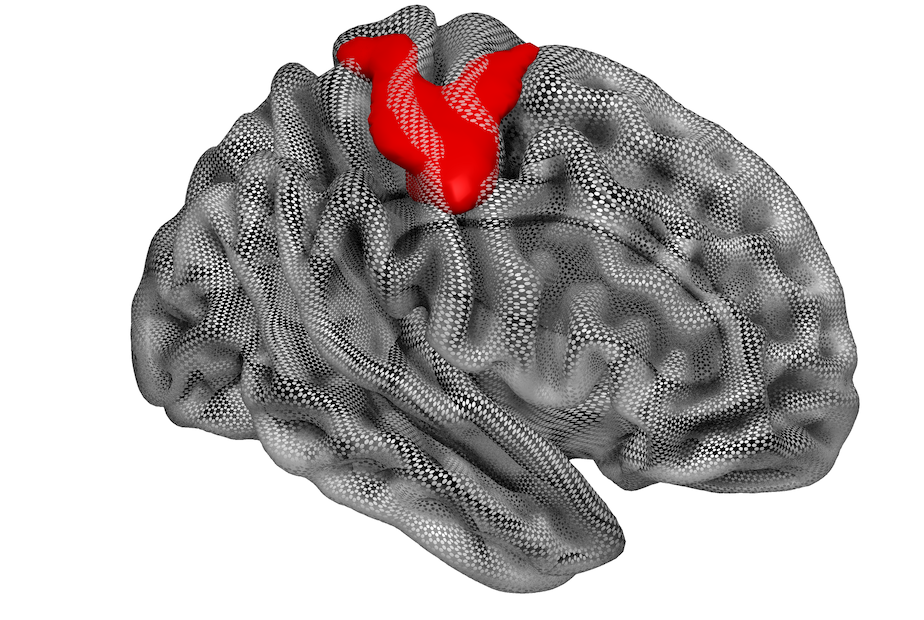
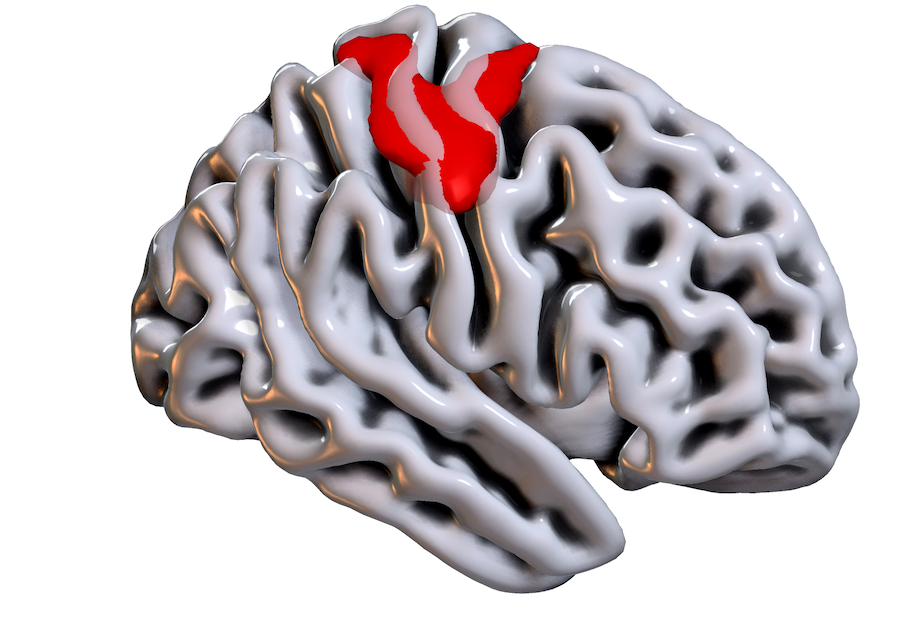
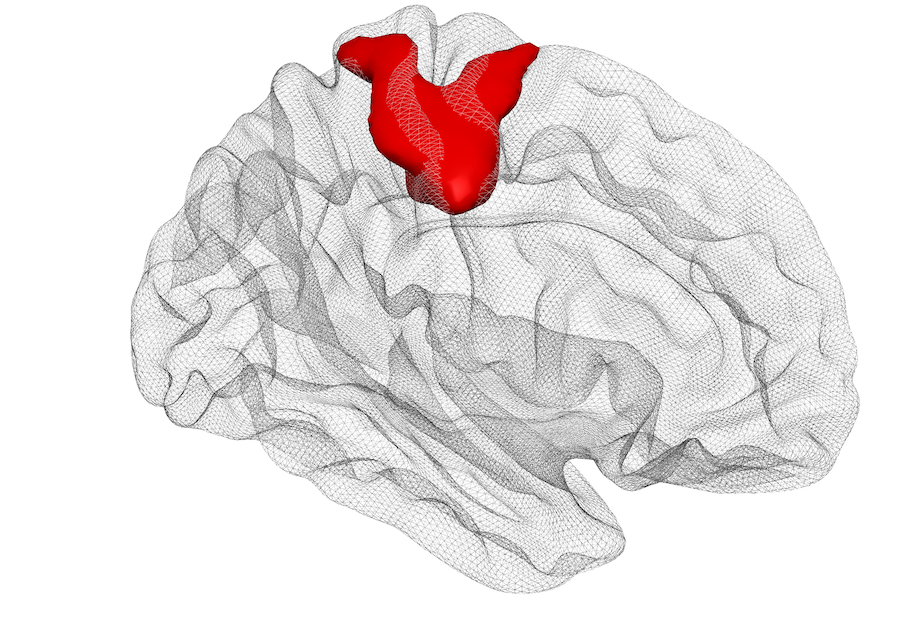
You may try out Surfice. You can either use the graphical interface or use the Python scripting. Here is the Scripting/Templates/fmri_mesh menu item where I have specified the ‘wire’ shader:
gl.resetdefaults()
gl.meshload('BrainMesh_ICBM152.rh.mz3')
gl.overlayload('motor_4t95mesh.rh.mz3')
gl.overlaycolorname(1, 'red')
gl.shaderxray(1.0, 0.3)
gl.azimuthelevation(110, 15)
gl.shadername('wire')
gl.meshcurv()
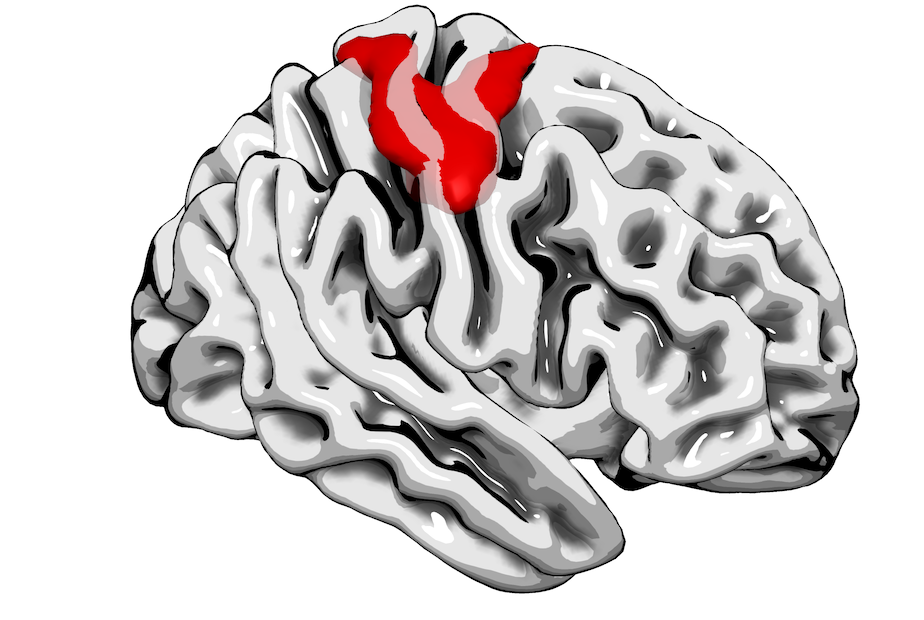
Below are several examples, the drop down menu in the top-left of the Render panel allows you to try out different shaders.
2 Likes
It is weird that plot_img_on_surf fails. If you can share the image, I’d be curious to understand what’s going on.
Best,
Bertrand
Hi Bertrand,
I don’t think it fails per se … its just that I’m trying to plot a small ~20voxel hippocampal cluster, and you can see a sliver of blue if you look very closely to the right, but the little flap is hiding most of it?
Would you like me to share the nifti file with you?