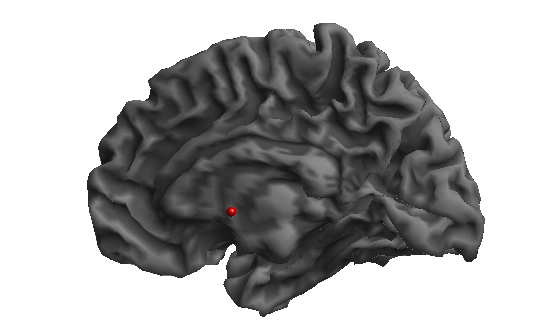
See if any of the ways posted here are useful for you.
https://afni.nimh.nih.gov/pub/dist/doc/htmldoc/tutorials/rois_corr_vis/suma_spheres.html
See if any of the ways posted here are useful for you.
https://afni.nimh.nih.gov/pub/dist/doc/htmldoc/tutorials/rois_corr_vis/suma_spheres.html
Another option could be to use a separate program to annotate your image. For example, you could use MRIcroGL to generate your brain map image (I believe that your example image was generated with MRIcroGL). Then you could load that image into a generic image editing program such as GIMP, and annotate it as you wish.
Surf Ice is an excellent tool, like MRIcroGL and also from Chris Rorden, that can be used to place markers too.
https://www.nitrc.org/plugins/mwiki/index.php/surfice:MainPage#Loading_nodes
You could try the NiiVue pointset live demo which allows you to edit spheres (add, remove, color, resize). This is a very primitive demo, but it previews the future viewer from the AFNI, FSL, FreeSurfer, MRIcroGL, and nilearn teams.
Thank you! MRIcroGL seems great. But coding is not available in MRIcroGL and I have too many ROIs to draw. It would take too much time.
MRIcroGL does support Python scripts - try the Scripting/Templates sub menus to see scripts. The Scripting/Templates/help provides an exhaustive list of inbuilt functions. However, it unlike Surfice and NiiVue it does not support connectome formats, so you can not easily add sphere.
As @ dglen noted, you might want to try Surfice.
Create a text file and save it with the .node extension (e.g. filename.node) where the the first three columns are the X, Y, Z coordinates, the next column is a scalar for color and the next is a scalar for size and the final column is name. Consider three nodes of different color (intensity) but the same size:
45	28	35	1	1	SuperiorFrontal
55	37	25	2	1	MiddleFrontal
65	28	8	3	1	InferiorFrontal
You can then use the Node/AddNodeOrEdge menu item to load your nodes, and use the nodes panel to adjust properties.
As a concrete example, I ran the scripting/templates/matcapPainted to load a pretty mesh and statistical map, and then chose the Node/Add… menu item to load the three nodes I describe above:
Just make sure to use a mesh that uses the same space as your nodes. The XRay sliders are useful to visualize subcortical nodes.
Thank you!
Other statistical results in my manuscript are all displayed on the SPM surface file (spm12\canonical /cortex_20484.surf.gii) . Now, if I display the stimulation locations using Surfice, which mesh file should I use to maintain consistency with the other figures?
Both Surfice and NiiVue can view GIFTI format meshes like those distributed with SPM.
With Surfice, you can drag and drop, use the File/Open menu item or you can use meshload in your Python script.
GIFTI is a common format, so it works across many tools. The exception is GIFTI files created by FreeSurfer, which can include an undocumented spatial transform that most other tools are not aware of.
Thank you very much!
I have been trying to use this software. Once you open it, you can’t stop using it, it’s so captivating. However, I encountered some new issues.
Which template is the prettiest for showing brain volume?
Besides showing stimulation locations, I also need to show the ROI locations. I think it might be better to show the ROIs on the original undeformed brain volume. Because that is where we conducted ROI analyses. And I tried to show them on the surface. But many ROIs look not in contact with the brain tissue.
How to display only one hemisphere in Surfice, similar to the picture below?
When I load the surface files from SPM into Surfice, both hemispheres are automatically displayed, and I would like to show only one hemisphere.

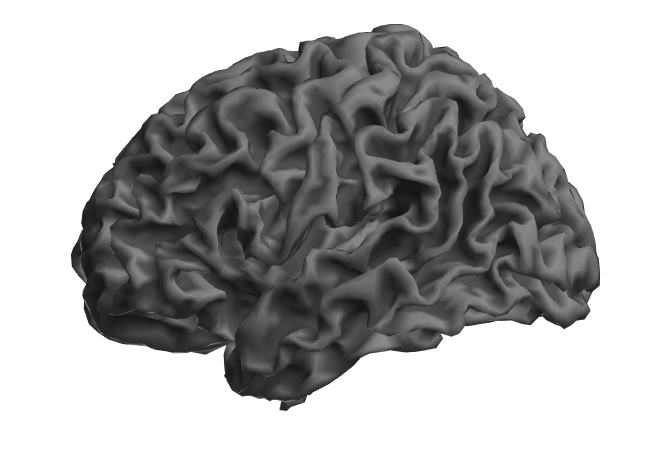
How can I adjust the visualization style in Surfice to match the rendered images from SPM?
The graphs generated by Surfice appear very different from the statistical graphs from SPM that I have used in my manuscript. Since SPM does not allow me to adjust the output style, I am wondering if there is a way to achieve a similar visual style in Surfice (But I want to keep the shining part of style if possible).
Surfice:

I would choose the mesh that represents your source data best. This depends on the tool you use (SPM, FreeSurfer, AFNI, FSL) - Surfice supports meshes from all these tools.
This is a property of your meshes, not Surfice. The meshes that come with SPM are bilateral, and include both hemispheres in a single file. The meshes that come with FreeSrufer and AFNI are unilateral with one file per hemisphere: you can load either hemisphere independently or use the File/OpenBilateral to open both hemispheres.
Choose the drop down menu in the Render panel to choose your shader. For example, the ‘phong’ shader is shiny by default, while the phong matte is not shiny. Once you have selected a shader, adjust the sliders associated with it. For example, the Phong shader is initially shiny, but you can reduce the specular slider to give it a dull, matte finish.
NiiVue is a web module so it does not need to be installed. It will provide a common visualization tool for AFNI, FSL, FreeSurfer and nilearn as they embrace web technologies.
I would suggest you try out the Scripting/Templates menu items, these not only show features, but you can see how it interactively changes the user interface to generate the different views. For example, the subcortical script shows different methods to see subcortical information that is underneath a cortical surface:

You may also enjoy the manual.
Thanks a lot!
What mesh file of brain volume (not inflated surface) would you recommend if I use SPM. I only find some brain volume meshes under the folder sample/. Are all of them in the same space as the SPM files?
Besides, is it possible to isolate the two hemispheres in the SPM mesh so that I can show only one hemisphere. Or are there other methods to only show one hemisphere if the mesh contains both hemispheres?
You can use the sliders in the Clipping panel to set the clip plane to isolate one hemisphere (hint: click on the Depth, Elevation and Azimuth to increment these sliders by sensible amounts). However, note that the SPM mesh connects both hemispheres through the corpus callosum, so you will see tearing artifacts that are a property of the source mesh.
Beware that SPM uses an average brain size, whereas most other tools use the MNI template that is larger than average - see Figure 1 of Horne et al.. My visualization software is agnostic and attempts to support all popular formats. However, if you have specific questions about a processing pipeline you should raise issues with their own support group, in your case the SPM jiscmail group.
You can always use the Advanced/ConvertVoxelwiseVolumeToMesh menu item to convert a voxel data that matches your analysis to a mesh. For example, in SPM this might be the averaged brain extracted anatomical scan for your population. Below is an example of this function applied to the spm152 scan that comes with MRIcroGL:
I’m so thankful for your help!
I tried opening the ‘mni153_2009.curv’ file, but it gave an error message: ‘Unable to load overlay: load the background mesh first.’
I also tried opening the ‘mni152_2009.mz3’ file, which displayed a pink brain volume. It seems this file contains both a mesh and an overlay.
Additionally, I opened the ‘mni152_2009AO.mz3’ file, which showed a pink brain volume with dark sulcus, and the ‘mni152_2009mini.mz3’ file, which displayed a pink brain volume with fewer details.
Could you explain the differences between these files?
I attempted to change the pink brain to gray like the color style in this picture (change only the color style and keep brain volume unchanged):

Or at least like this color style :
But I was unsuccessful despite trying all the options from dropdown buttons (in the red circles in picture below).
What am I doing wrong?
I also tried using ‘ConvertVoxelwiseVolumeToMesh’ to transform file spm152.nii.gz (from MRIcroGL), but the generated mesh (see picture below) is not satisfactory as yours.
FreeSurfer ‘.curv’ file is a cruvature file that describes the curvature of vertices (is the vertex a ridge or a valley). The curvature file can not be viewed without a mesh file that defines the position and connections of a mesh. We usually use curvature files to make the sulci look darker than the gyri, emulating the way that less light illuminates crevices.
The mni152_2009AO.mz3 file has ambient occlusion included with the same file as the mesh. This single file packs the same information as the combination of the two files of a FreeSurfer mesh and FreeSurfer curvature file. The mni152_2009mini.mz3 has a small file size on disk because it has far fewer triangles - you can see this by choosing the wireframe shader in the render drop down menu.
You were unsuccessful in changing the mesh color because you were selecting the color scheme for your .curv file overlay - remember the curve files define the color of the crevices not the mesh itself. Choose Color/QuickColors/Gray to set a neutral color to the mesh, or Color/ObjectColor to set a custom color.
When you converted your spm152 file to a mesh, you chose a very low intensity threshold for your isosurface, so even dark CSF was counted as part of the mesh boundary. Note that when you set the threshold value, you will interactively see the result, so you can choose a good value. Note that when you apply this function for the image spm152 it suggests three potential thresholds based on Otsu’s method: 16, 46, 65. A value of around 16 will create a boundary between the darkest voxels (air) and the relatively dark CSF. A value of 46 will will create the isosurface between the dark CSF and the brighter gray matter. Finally, a value of around 65 will segment the bright gray matter from the brightest white matter. You can choose a threshold that best suits your use case.
Many thanks!
About the .node file, the unit of the column for size is millimeter, right?
Besides, I noticed the final column contains names. Can we label the nodes directly in Surfice? Namely, can we mark the names of corresponding brain regions on the graph?
The node size typically refers to the radius of the node in millimeters, though note that you have a slider in the node panel that allows you to multiply the base node size by a zoom factor. The scripting/templates/node Python script shows you how to use set the nodesize programmatically:
nodesize (built-in function):
 nodesize(size, varies) -> Determine size scaling factor for nodes.
Note that you can make all your spheres have a constant size, or have larger spheres reflect a larger effect size, hub weight, more extreme statistical significance, etc.
Thank you very much!
It’s crucial for me to set the appropriate size of ROIs. However, my sufice automatically zooms nodes whenever I add nodes.
I am unsure how much I need to slide the slider in order to achieve the desired size of nodes specified in the .node file. And we can’t also input an exact value to adjust the size.
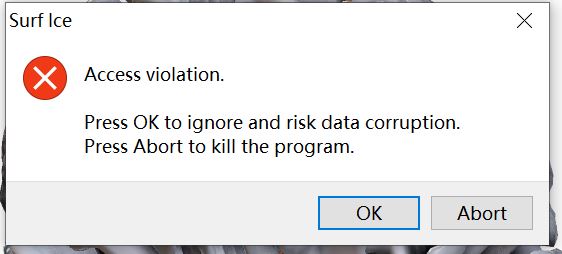
Moreover, when I attempt to minimize the zooming slider, error messages start popping up, and the 3D mesh becomes unresponsive after pressing any of the buttons: OK, cancel or abort.

Besides, I tried to use the code to set the size:
import gl
gl.resetdefaults()
gl.meshload('cortex_20484.surf.gii')
gl.azimuthelevation(110, 15)
gl.shadername('MatCap');
gl.meshcurv()
nodeload('test.node')
nodesize(8, false)
It doesn’t work.
The error messages said: NameError: name 'nodeload' is not defined.
My node file for testing contains:
 0   60   60   30   8     tq
 20  60   60   20   8     ew
 40  60   60   10   8     se
These functions are part of the ‘gl’ module, so prefix with gl: gl.nodeload(“filename.node”)
Thank you!
I don’t know how to use the function gl.nodesize properly and don’t find any clues on the internet.
So I asked gpt-4 and got answer right away:
The function has two parameters: size and varies. The size parameter is a number that determines the radius of the nodes in millimeters. The varies parameter is either 0 or 1, indicating whether the color of nodes will differ depending on size or intensity. For example, if you want to set the node size to 3 mm and the node color to vary, you can use the following command:
gl.nodesize(3, 1)
But the answer seems not right.
Does the first parameter define how much to magnify the sphere? If I don’t want to magnify it and keep the size defined in the node file, can I set this parameter to 1?
Is GPT’s view on the second parameter right?
Try setting the fifth column of your input file to something smaller. Use 1 instead of the 8 in your example.
MANAGED BY INCF