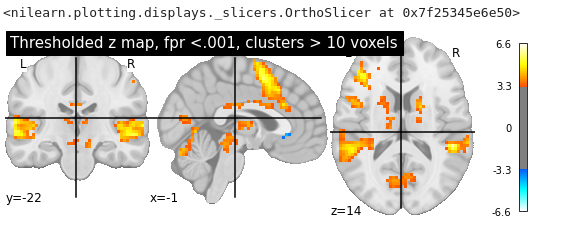
I’m using nilearn to analyze and visualize my fMRI GLM results. But it looks very burry. Here is the second-level activation map in nilearn (05_glm_second_level/plot_thresholding.html#visualize-the-results). Is there any way to produce high-resolution activation map like MRIcroGL in nilearn?
Here is a high-resolution example from this paper. Not sure what software they used to produced it.
Hi @ymzayek Thanks for your nice solution! I have a more general question about whether there are some disadvantages of resampling since I rarely see people use it. Is it because of distortion induced by interpolation algorithms?
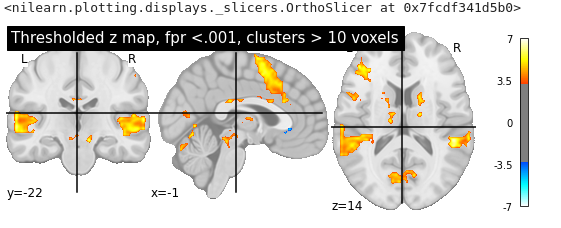
In the context of the above example, you need to resample since the statistical image and template have different voxel sizes. This is because the pre-computed contrasts that are loaded have a different resolution than the template I loaded in 1mm³ resolution. It wouldn’t be needed if you calculated a higher resolution contrast map on your own data as long as it has the same resolution as whatever template you use. I’m not an expert but I think the disadvantages of resampling depend on the interpolation method as well as at what step it is applied in a processing pipeline. And these disadvantages can sometimes be acceptable depending on what you’re trying to do (e.g. makes sense here for visualization). But I cannot speak more generally about the appropriateness of resampling in regards to fmri processing steps. @bthirion might have some more insight?
Rsampling data to high resolution increases you storage and processing cost for no benefit, so the idea is that you deal with your data at their original resolution. When it comes to plotting, you’re indeed happy that the plotting function nicely interpolates the image
Best,
Bertrand