Hi all
I have a 3D brain volume (nifti) in MNI space. I want to plot this map on a surface like the fsaverage.
The intended output is something like this Fig1. E in https://www.pnas.org/content/113/44/12574
How can I do that? I am open to use any software to achieve this
1 Like
Hi Makaros622,
This tutorial shows you how to fetch fsaverage with nilearn, and then use plot_surf_stat_map or plot_img_on_surf to get either a single view or multiple surface views. You can also use view_surf for interactive viewer in the browser.
https://nilearn.github.io/auto_examples/01_plotting/plot_3d_map_to_surface_projection.html#sphx-glr-auto-examples-01-plotting-plot-3d-map-to-surface-projection-py
If your data was aligned with the colin27 atlas, you may want to check this tool by @danjgale GitHub - danjgale/reg-fusion: Python implementation of Wu et al (2018)'s registration fusion
Best,
Pierre
1 Like
Also, because you referenced the PNAS papers on gradients, you may want to check the brainspace toolbox. Welcome to BrainSpace’s documentation! — BrainSpace 0.1.1 documentation
It was designed for gradient analyses and has very nice visualizations just like the Fig 1 you referenced.
Thanks for the reply.
I have tried to use nilearn but it does not work. This is because texture variable contains NaN but no idea why…
Code:
import numpy as np, os, sys
from nilearn import plotting, datasets; from nilearn.surface import load_surf_data
import numpy as np, os, warnings, matplotlib.pyplot as plt
from matplotlib.ticker import FormatStrFormatter
from matplotlib import ticker
from mpl_toolkits.mplot3d import Axes3D
from nilearn import surface

hemisphere = 'left'
view = 'medial'
black_bg = True
colorbar= True
cmap = 'hsv'

# Load the surface
fsaverage = datasets.fetch_surf_fsaverage('fsaverage')

# The stat map
stat_img = '/Users/makis/Desktop/stat_map.nii'

# The texture
texture = surface.vol_to_surf(stat_img, fsaverage.pial_left)

fig = plt.figure(dpi=300)
ax = fig.add_subplot(111, projection='3d')
plt.gcf().axes[0].yaxis.set_major_formatter(ticker.FormatStrFormatter("%f"))
# Plotting
plotting.plot_surf_roi(fsaverage["infl_{}".format(hemisphere)], roi_map = texture, \
	hemi = hemisphere, view = view, bg_map = fsaverage["sulc_{}".format(hemisphere)], \
	bg_on_data = True, darkness = 0.6, output_file = 'mapped_signal.png', \
	cmap = cmap, colorbar = colorbar, black_bg=black_bg, axes= ax, figure=fig, )
#for ax in plt.gcf().axes:
#	ax.yaxis.set_major_formatter(ticker.FormatStrFormatter(">%.4f<"))
plotting.show()
plt.close()
Data: Easyupload.io - Upload files for free and transfer big files easily.
Pass: makis
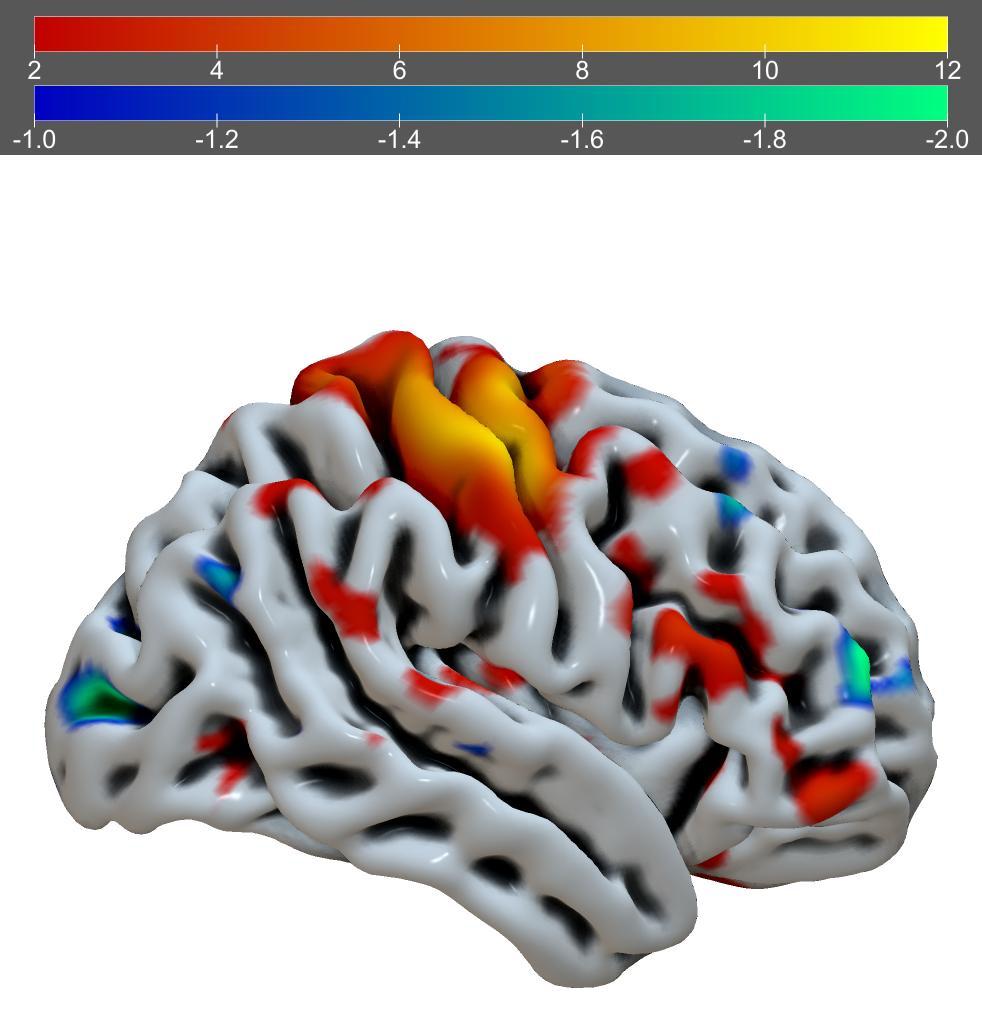
Given that your data is a voxel-based NIfTI image, you may want to consider using MRIcroGL. The example from Scripting/Templates/mosaic2 may be helpful:
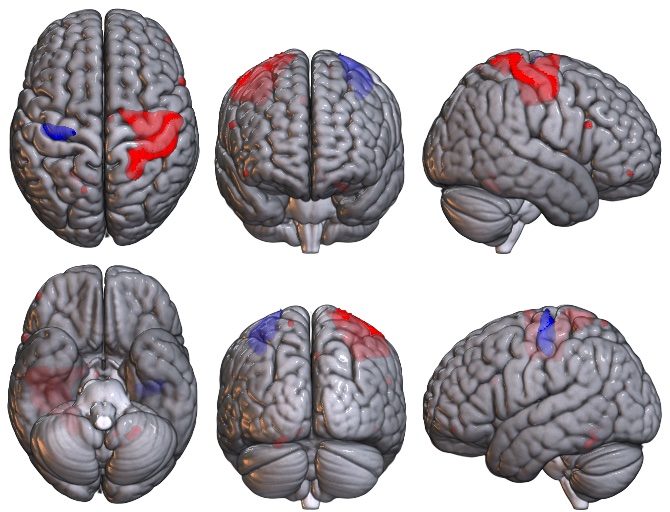
Warping voxel data onto meshes is always a bit tricky. However, if there is a tight correspondence you could try Surfice. Below is the example of the Scripting/Python/basic_paint_surface menu item.
Just to follow-up on using Nilearn here in particular (though I agree with @Chris_Rorden that MRIcroGL would also be a great choice !):
A few bug fixes for handling surfaces in Nilearn were recently merged:
The latter of which was specifically thanks to this post !  You should be able to access this updated code by installing nilearn directly from GitHub using something like the following:
pip install git+https://github.com/nilearn/nilearn.git
HTH,
Elizabeth
2 Likes
Great news! I will install the latest version.
1 Like
Updated link to the nilearn tutoriel, I noticed the old one is now broken thanks to a neurostars alert: Making a surface plot of a 3D statistical map - Nilearn