Hello,
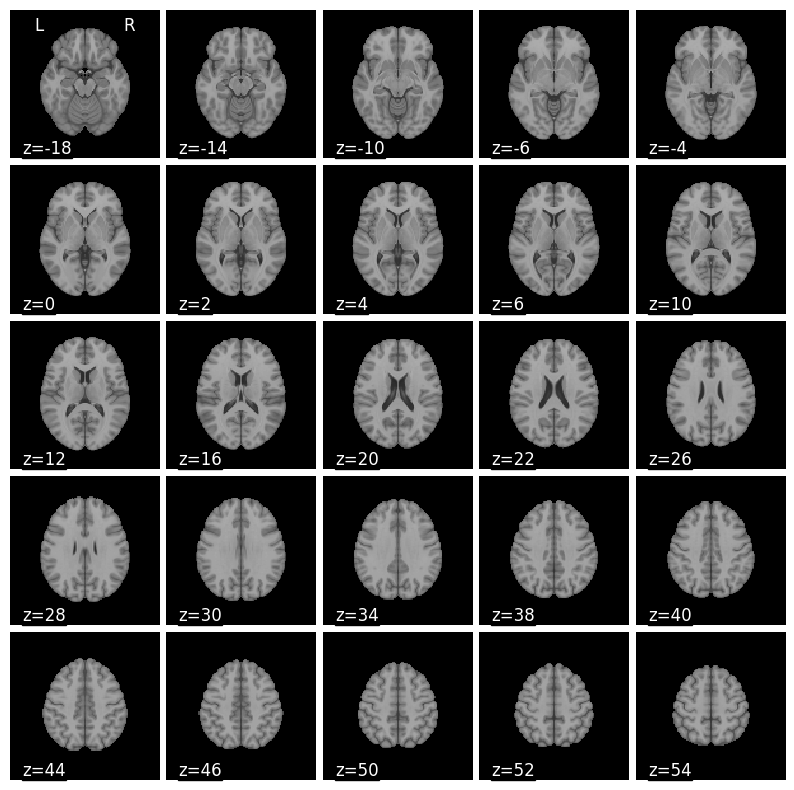
Basically I want 25 axial slices in (5,5) grid I explored almost all options but could not find the one which organizes 25 slices in (5,5) grid I have also attached the saved image of 25 slices as you can see is a single row. May I please get some guidance on how can I get it (5,5) grid 25 axial slices specifically?
plotting.plot_anat(nifti_obj,display_mode='z',output_file="test.png", cut_coords=25)
I think you will need to create the figure and axes yourself, for example with pyplot.subplots, then plot the slices one by one, each time specifying the axes with the axes parameter:
from matplotlib import pyplot as plt
from nilearn import datasets, plotting

img = datasets.load_mni152_template()

n_rows, n_cols = 5, 5
all_coords = plotting.find_cut_slices(
    img, direction="z", n_cuts=n_rows * n_cols
)

ax_size = 2.0
margin = 0.05
fig, all_axes = plt.subplots(
    n_rows,
    n_cols,
    figsize=(n_rows * ax_size, n_cols * ax_size),
    gridspec_kw={"hspace": margin, "wspace": margin},
)

left_right = True
for coord, ax in zip(all_coords, all_axes.ravel()):
    display = plotting.plot_anat(
        img, cut_coords=[coord], display_mode="z", axes=ax, annotate=False
    )
    display.annotate(left_right=left_right)
    # only show L R on the first (top left) axis
    left_right = False

plt.savefig("mni_slices.png", bbox_inches="tight")
2 Likes
Thank you @jeromedockes really appreciate it I understand what you are doing here really helpful
1 Like