Dear Community,
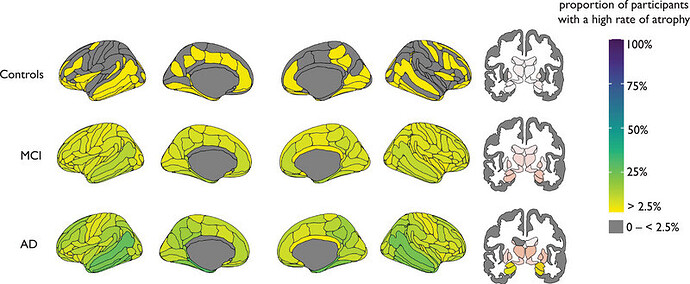
I am currently working on visualizing ROI boundaries on the brain surface using the Harvard-Oxford brain atlas. My goal is to generate a surface plot that overlays ROI boundaries from the atlas in a clear and accurate manner.
I also tried visualizing in Freeview, connectome_workbench, and I could plot the surface but I was unable to plot the boundaries correctly.
Specific challenges I’m facing:
I don’t know how to combine the ROI boundaries with a functional surface overlay while keeping the boundaries visible.
I would really appreciate any tips, example commands, or references to similar workflows. Thank you in advance for your help!
