Hi experts,
I need help with rendering EEG source-reconstructed maps like this figure:
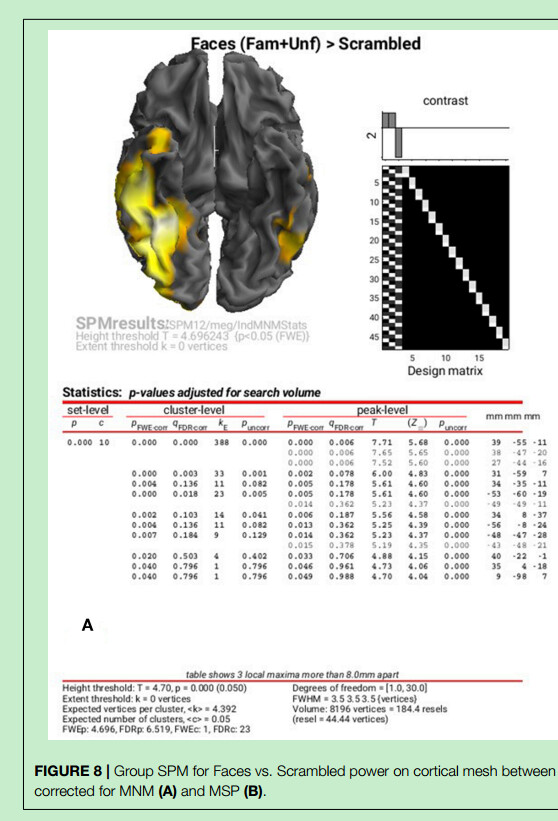
(Richard Henson et al, 2019,Multimodal Integration of M/EEG and f/MRI Data in SPM12. Frontiers in neuroscience )
I have tried using the “Display – Render” option. Not to mention the rendered brain does not appear in the same position (It appears at bottom part rather than the top-left part of the figure “Graphics”). Despite trying various files in the spm12/canonical directory, I couldn’t achieve the exact fully expanded surface as shown in the figure.
I also tried using the rendering code provided following the paper from which the figure was taken:
spm_mesh_render('View',get(findobj(spm_figure('GetWin','Graphics'),'Tag','SPMMeshRender'),'Parent'),'bottom')
However, when running the code (after getting glass brain image), I encountered the following error messages in the command window:
Error using camlight (line 60)
is an invalid argument
Error in spm_mesh_render>myView (line 567)
camlight(H.light);
Error in spm_mesh_render (line 362)
        myView([],[],H,v);
I’m not sure what went wrong. Any assistance would be greatly appreciated.
Version:
SPM12: v7771
Environment (Docker, Singularity, custom installation):
matlab 2016a, Win 10