Hi,
I want to visualize my streamline tracts from mrtrix3(.tck file) in DIPY, I tried the codes in DIPY : Docs 1.7.0 - Visualize bundles and metrics on bundles
However, my tract image has no orientation color but just a specific color. I have no idea about this.
My codes as follows:
import numpy as np
from dipy.viz import window, actor, colormap, ui
from dipy.io.streamline import load_tck
from dipy.io.image import load_nifti
# loadt tck
tckfile = load_tck("tract.tck", "dti.nii.gz")
# load struture
imgT1, imgT1_affine = load_nifti("T1.nii.gz")
scene = window.Scene()
stream_actor = actor.line(tckfile.streamlines)
scene.add(stream_actor)
imgT1_actor = actor.slicer(imgT1, imgT1_affine)
scene.add(imgT1_actor)
show_m = window.ShowManager(scene, size=(800, 600))
show_m.initialize()
show_m.start()
Furthermore, I actually want to render the streamline like this:
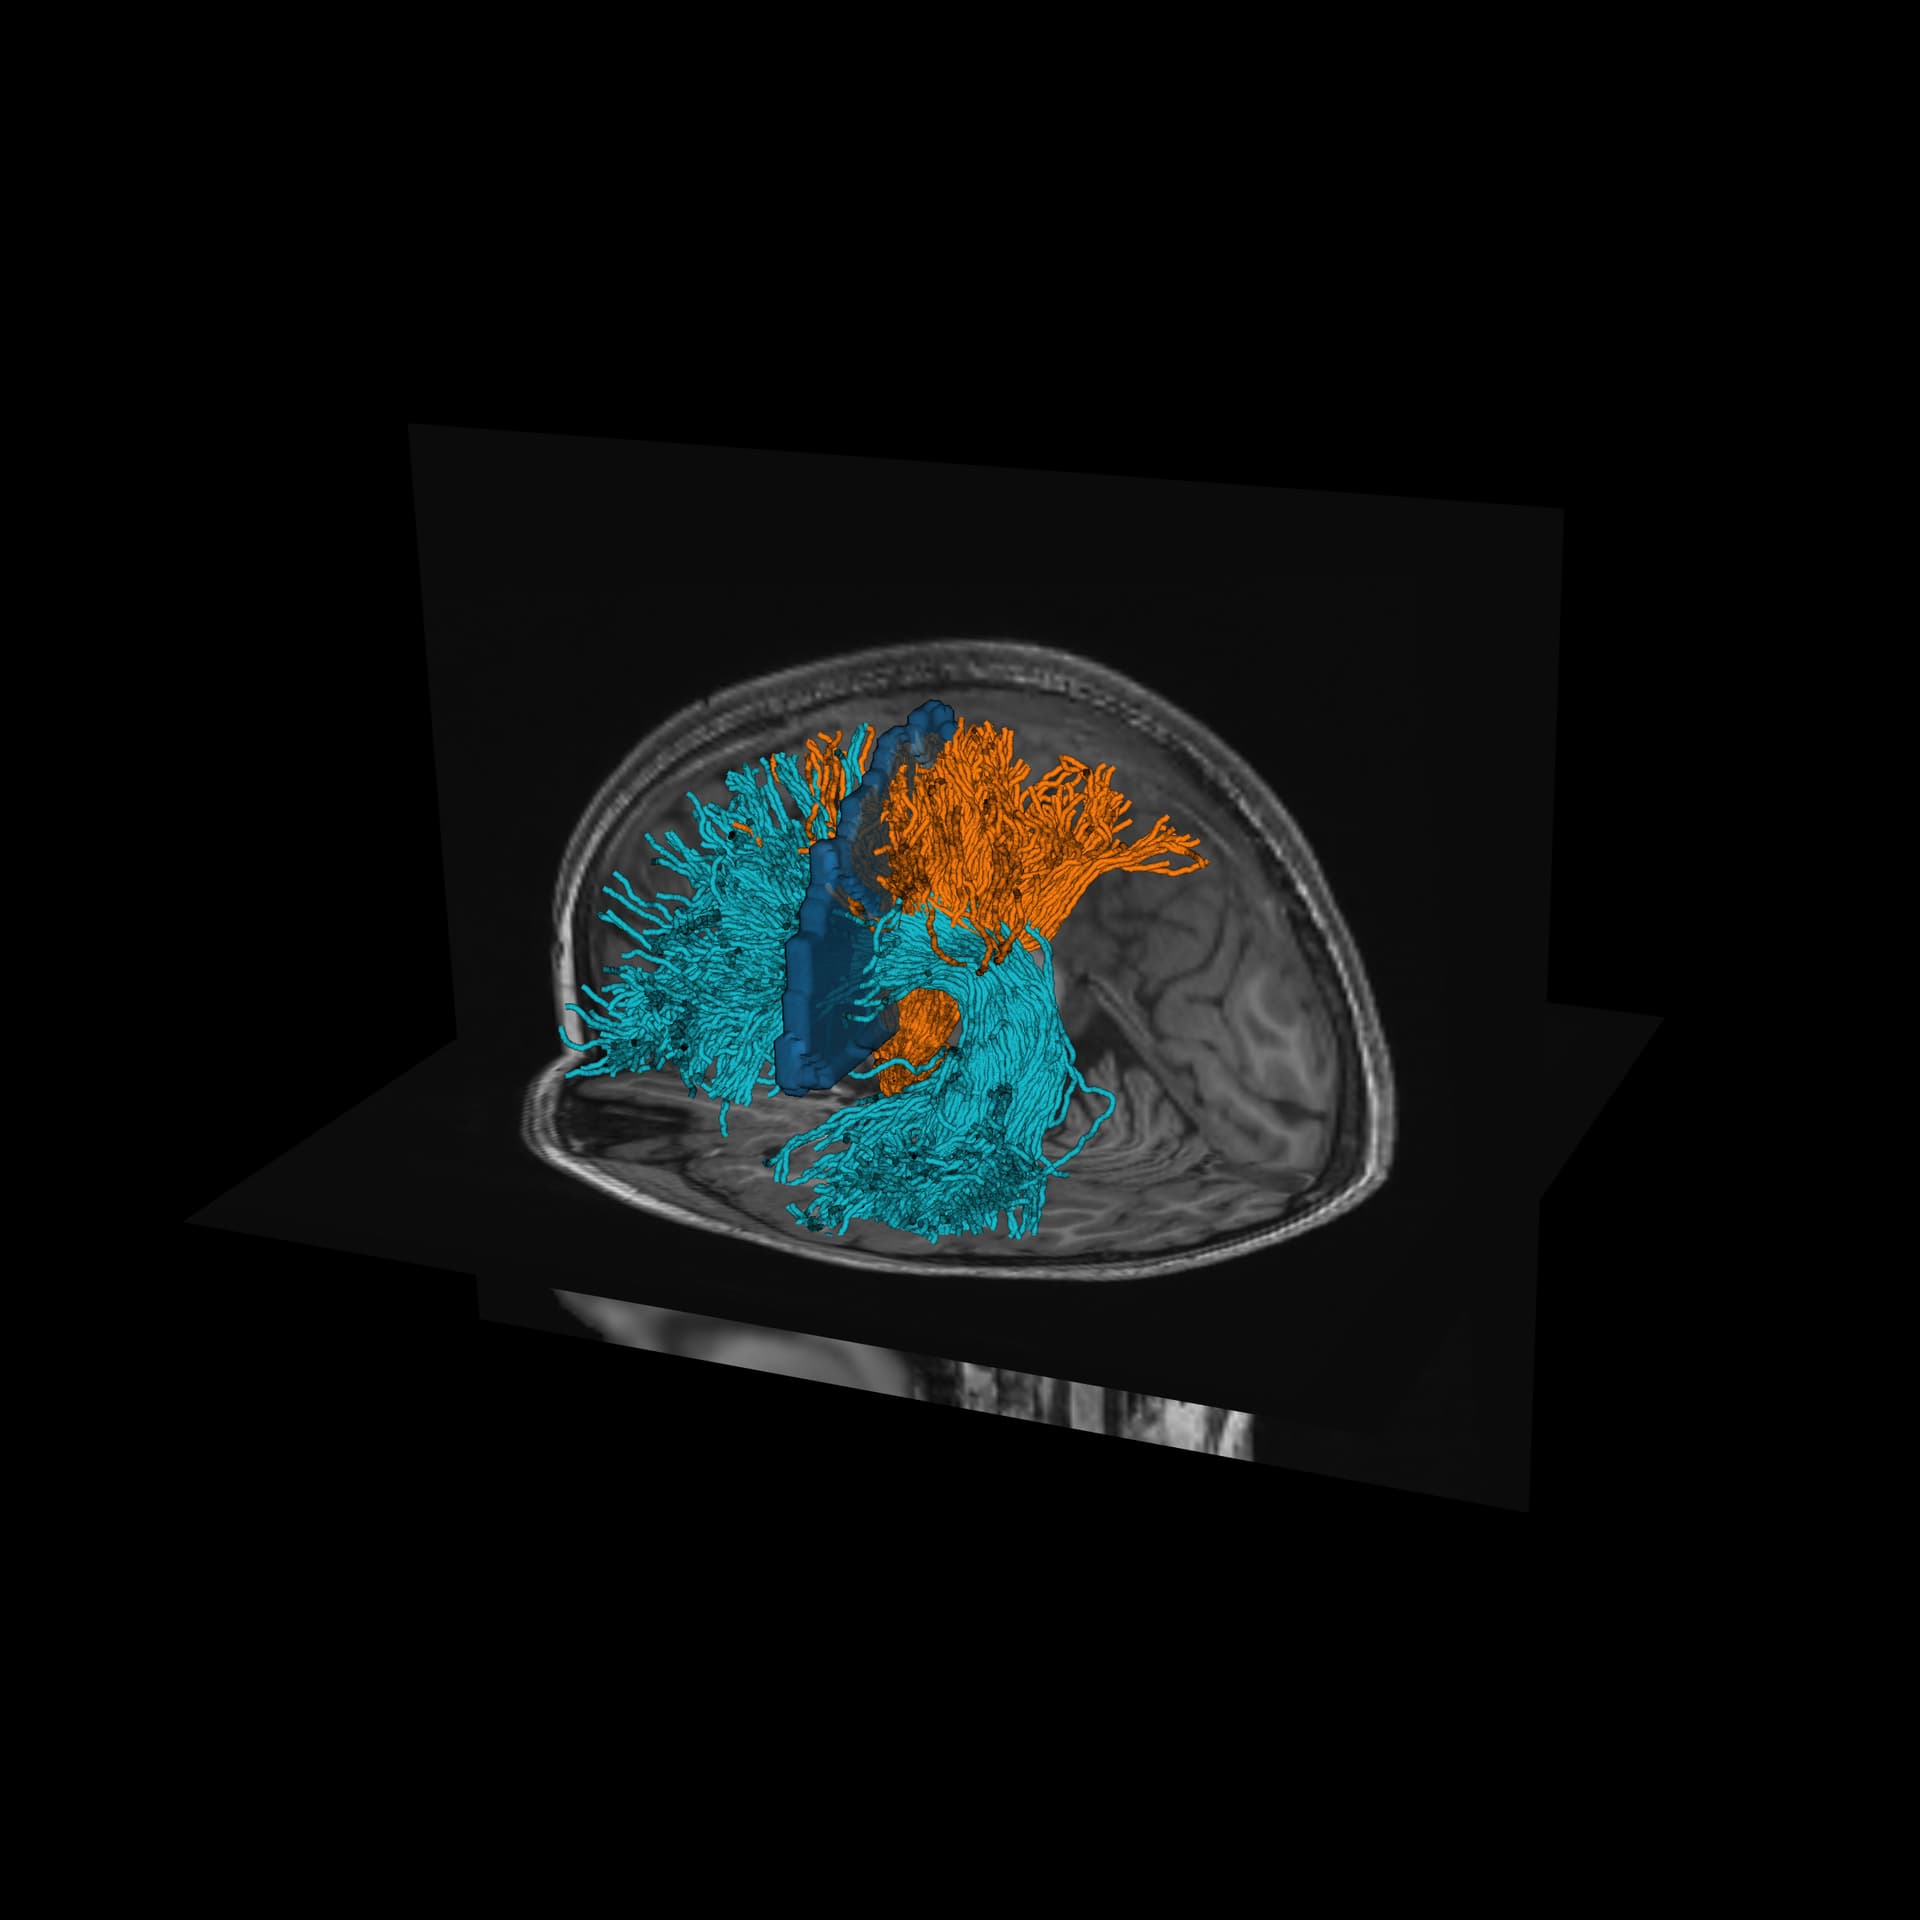
Any idea or reference code to achieve this?
PS: I tried this example (Visualizing AFQ derivatives — AFQ 1.0.1 documentation), when I download data provided by the example (HBN POD2), I can get the same result (same as the pic above). But if I load my own tract file (.tck generated from mrtrix3), I can not use the orientation color. Does the tck file lost some information? But I remember when I loaded it, I provided space file (tckfile = load_tck(“tract.tck”, “dti.nii.gz”)). I really have no idea about it.
Thanks a lot!