My objective is to compare diffusion metrics (FA, MD, AD and RD) between three groups.
I performed a pre-processing step with QSIPREP and a reconstruction using a modified version of the mrtrix_multishell_msmt_pyafq_tractometry pipeline, allowing me to obtain segmented bundles (.trk) as well as a CSV file for each subject. This CSV file shows the value of the metrics for each tract over the 100 points defined by pyAFQ.
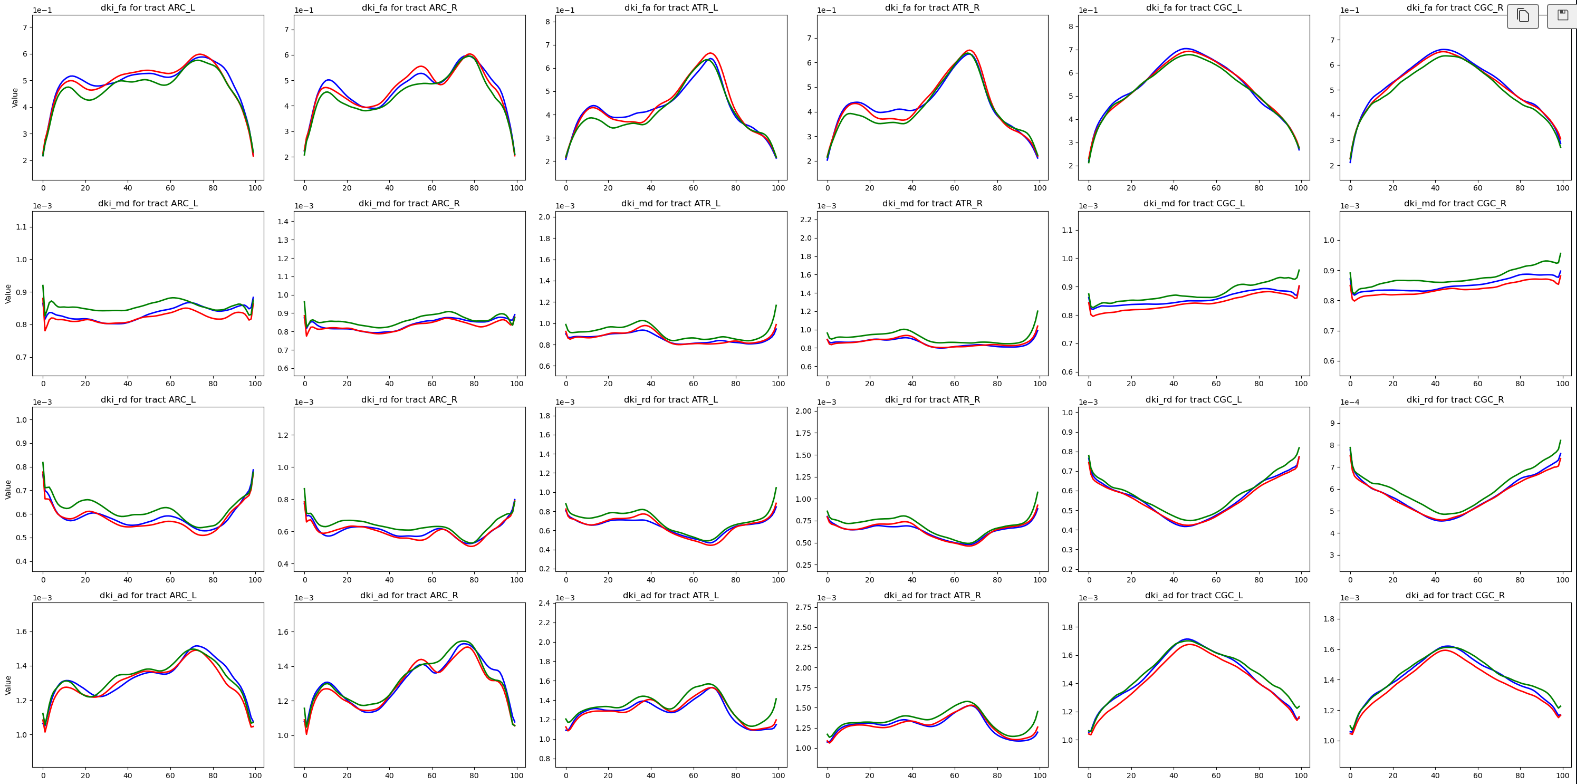
Using Python code, I was able to calculate the average metrics for each group on the different tracts, as shown in the following figure :
However, in order to obtain more precise statistics to determine any correlation between the groups, it seems necessary to carry out a statistical test for each point along the tract and for each group.
However, even after consulting DIPY’s documentation, examining its source code or exploring the forums, I was unable to find the elements needed to reproduce the same graphics and statistics as those presented in the aforementioned article.
If someone have encountered this difficulty or experienced a similar situation, I would be great if you could share some tips.
It looks like this DIPY documentation (DIPY : Docs 1.6.0. - BUndle ANalytics (BUAN) framework) has the code to make similar figures to those in the article you link. Is there anything in particular about the documentation and how you would apply it to QSIRecon outputs that is unclear?
Do you know if there is a python api that will allow me to do these tests? Because the output of QSIPrep doesn’t seem to correspond to the type of tree structure that can be taken as input by dipy_buan_profiles.
Am I obliged to reproduce the same type of tree structure, or is it simpler to carry out the statistical analysis myself, using a specific test (linear mixed model or t-test with Bonferroni correction) on each point between 2 groups?
The idea is to use GAM models to account for the variation along the length of a bundle. The software is in pre-alpha status, but we’ve already published some work that used it (https://www.jneurosci.org/content/44/6/e0684232023), and have several other projects in the pipeline that use this approach. Let us know if you get a chance to try it out and run into any issues – we are interested in improving it’s usability.
Thank you for your question. You can use the dipy_buan_profiles commandline (DIPY — dipy 1.8.0 documentation) to generate bundle profiles of tracts with microstructural values associated with them. It will output .h5 files per bundle per metric, which you can use to do statistical analysis. You might need to make some changes to the default linear mixed model code, as currently, it only supports two groups. I am happy to help with any changes you require in the code or have any questions. Please reach out to me at chandio@usc.edu.
I would like to apply BUAN for QSIrecon output of “mrtrix_multishell_msmt_pyafq_tractometry” plus six custom bundles.
How should rec_bundles be obtained?
Should I apply the same analysis to the data in the common space (like HCP) and use them?
If my understanding is correct, org_bundles could be defined as follows:
sub-XX_coordsys-RASMM_trkmethod-probCSD_recogmethod-AFQ_desc-RightCorticospinal_tractography.trk