Hi Neurostars ![]()
I come from a virology/immunology lab that lacks experience in neuroscience and confocal microscopy. Recently, we have shifted our focus to neuroimmunology and observed a nice phenotype where our virus disrupts snyspes homeostasis. Our collaborator has shown excessive synaptic pruning by microglia in the infected mice samples that we have sent them, while our sc-data show upregulation of complement proteins in our sorted microglia. Therefore, we would like to implement new methods to analyze synapses and complement in our lab to be less reliant on our collaborators; however, we run into problems that I was not able to find solutions to in published papers, as the M&M methods are often written without too much detail.
After sacrificing the animals, the brains are immediately submerged for 24h in 4%PFA. The next day, the brain is transferred to PBS-azid and stored until cutting at +4. We cut 50 µm-thick brain slices on a Leica vibratome. For immunohistochemistry, we use the following primary antibodies: PSD95 (Cell Signaling, #D27E11), VGLUT 1 (SySy, #135304), and C3 (Hycult #HM1045). Sections are stained as free-floating sections (1 section per 48-well plate) using Triton X-100 (0.2%) permeabilization during the whole procedure. Sections are blocked with 3%BSA. Primary antibodies are incubated overnight at +4°C.
Regarding synapse quantification, we are currently attempting to perform the analysis ourselves. We image 3x 5 µm-thick z-stacks (15 optical planes of 0.34 µm z-step size) per section. Despite performing permeabilization during our staining process, we have observed that the antibody signals throughout our section are not uniform. Also, when we finally select a depth of interest to analyze (from the 50 µm-thick section), the beginning and end of the 5 µm-thick z-stacks do not show as clear and uniform signals as the middle, as the PSD95 and VGLUT 1 signals do not reach their maximum intensity at the same depth. This makes sense, since they are in different structures, but we are not sure which signal should be prioritized. Also, we have noticed that different ROI within the same section have different maximum intensities. How would you address these problems?
Do you guys encounter similar challenges, and how do you approach them? Could you let me know how thick your z-stacks typically are, and how many stacks per mouse or per slice you usually take? Also, do you take into account that the sections between mice are at a similar depth of cutting?
For the analysis, we are trying to use this paper https://www.cell.com/cell-reports-methods/fulltext/S2667-2375(24)00239-X with Ilastik for thresholding and the SynBot plugin for ImageJ. Any other suggestions or advice?
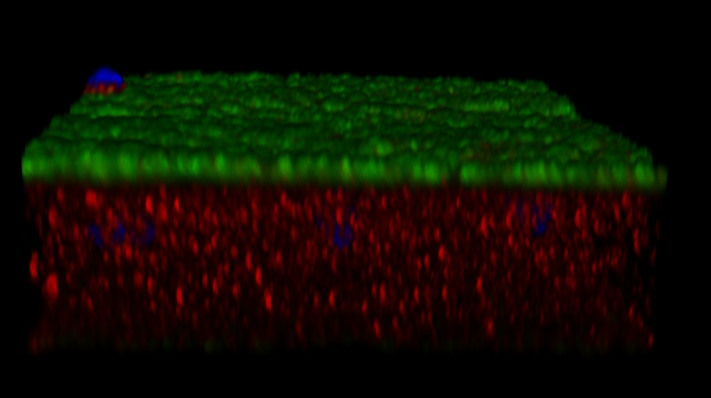
We are also analyzing the complement C3. We have the same issue (See attached image- Green-VGLUT1, RED-C3). The type of analysis that we are trying to perform can be found in DOI: 10.3389/fnagi.2025.1616390, Fig.2B. However, again, the same issue.
Any suggestions regarding either our protocol, problem, or analysis technique would be appreciated. I’ve lost a lot of time on this and haven’t moved much forward. While the biggest problem is that I don’t have anyone nearby to ask for help or advice, I am trying to introduce these new methods to our lab.
Thank you in advance for your time and advice.