Hi all,
We want to evaluate the reproducibility of the preprocessing pipeline for our resting-state analysis. We’re especially interested in ICA-AROMA, which has superior performance in dealing with head motion in resting-state functional images. To do so, we ran the same preprocessing pipeline on the same data twice. Specifically, we ran fmriprep with --use-aroma and set the random seed by --random-seed. In addition, we also included MNI152NLin6Asym:res-2 in --output-spaces to help us evaluate the output images.
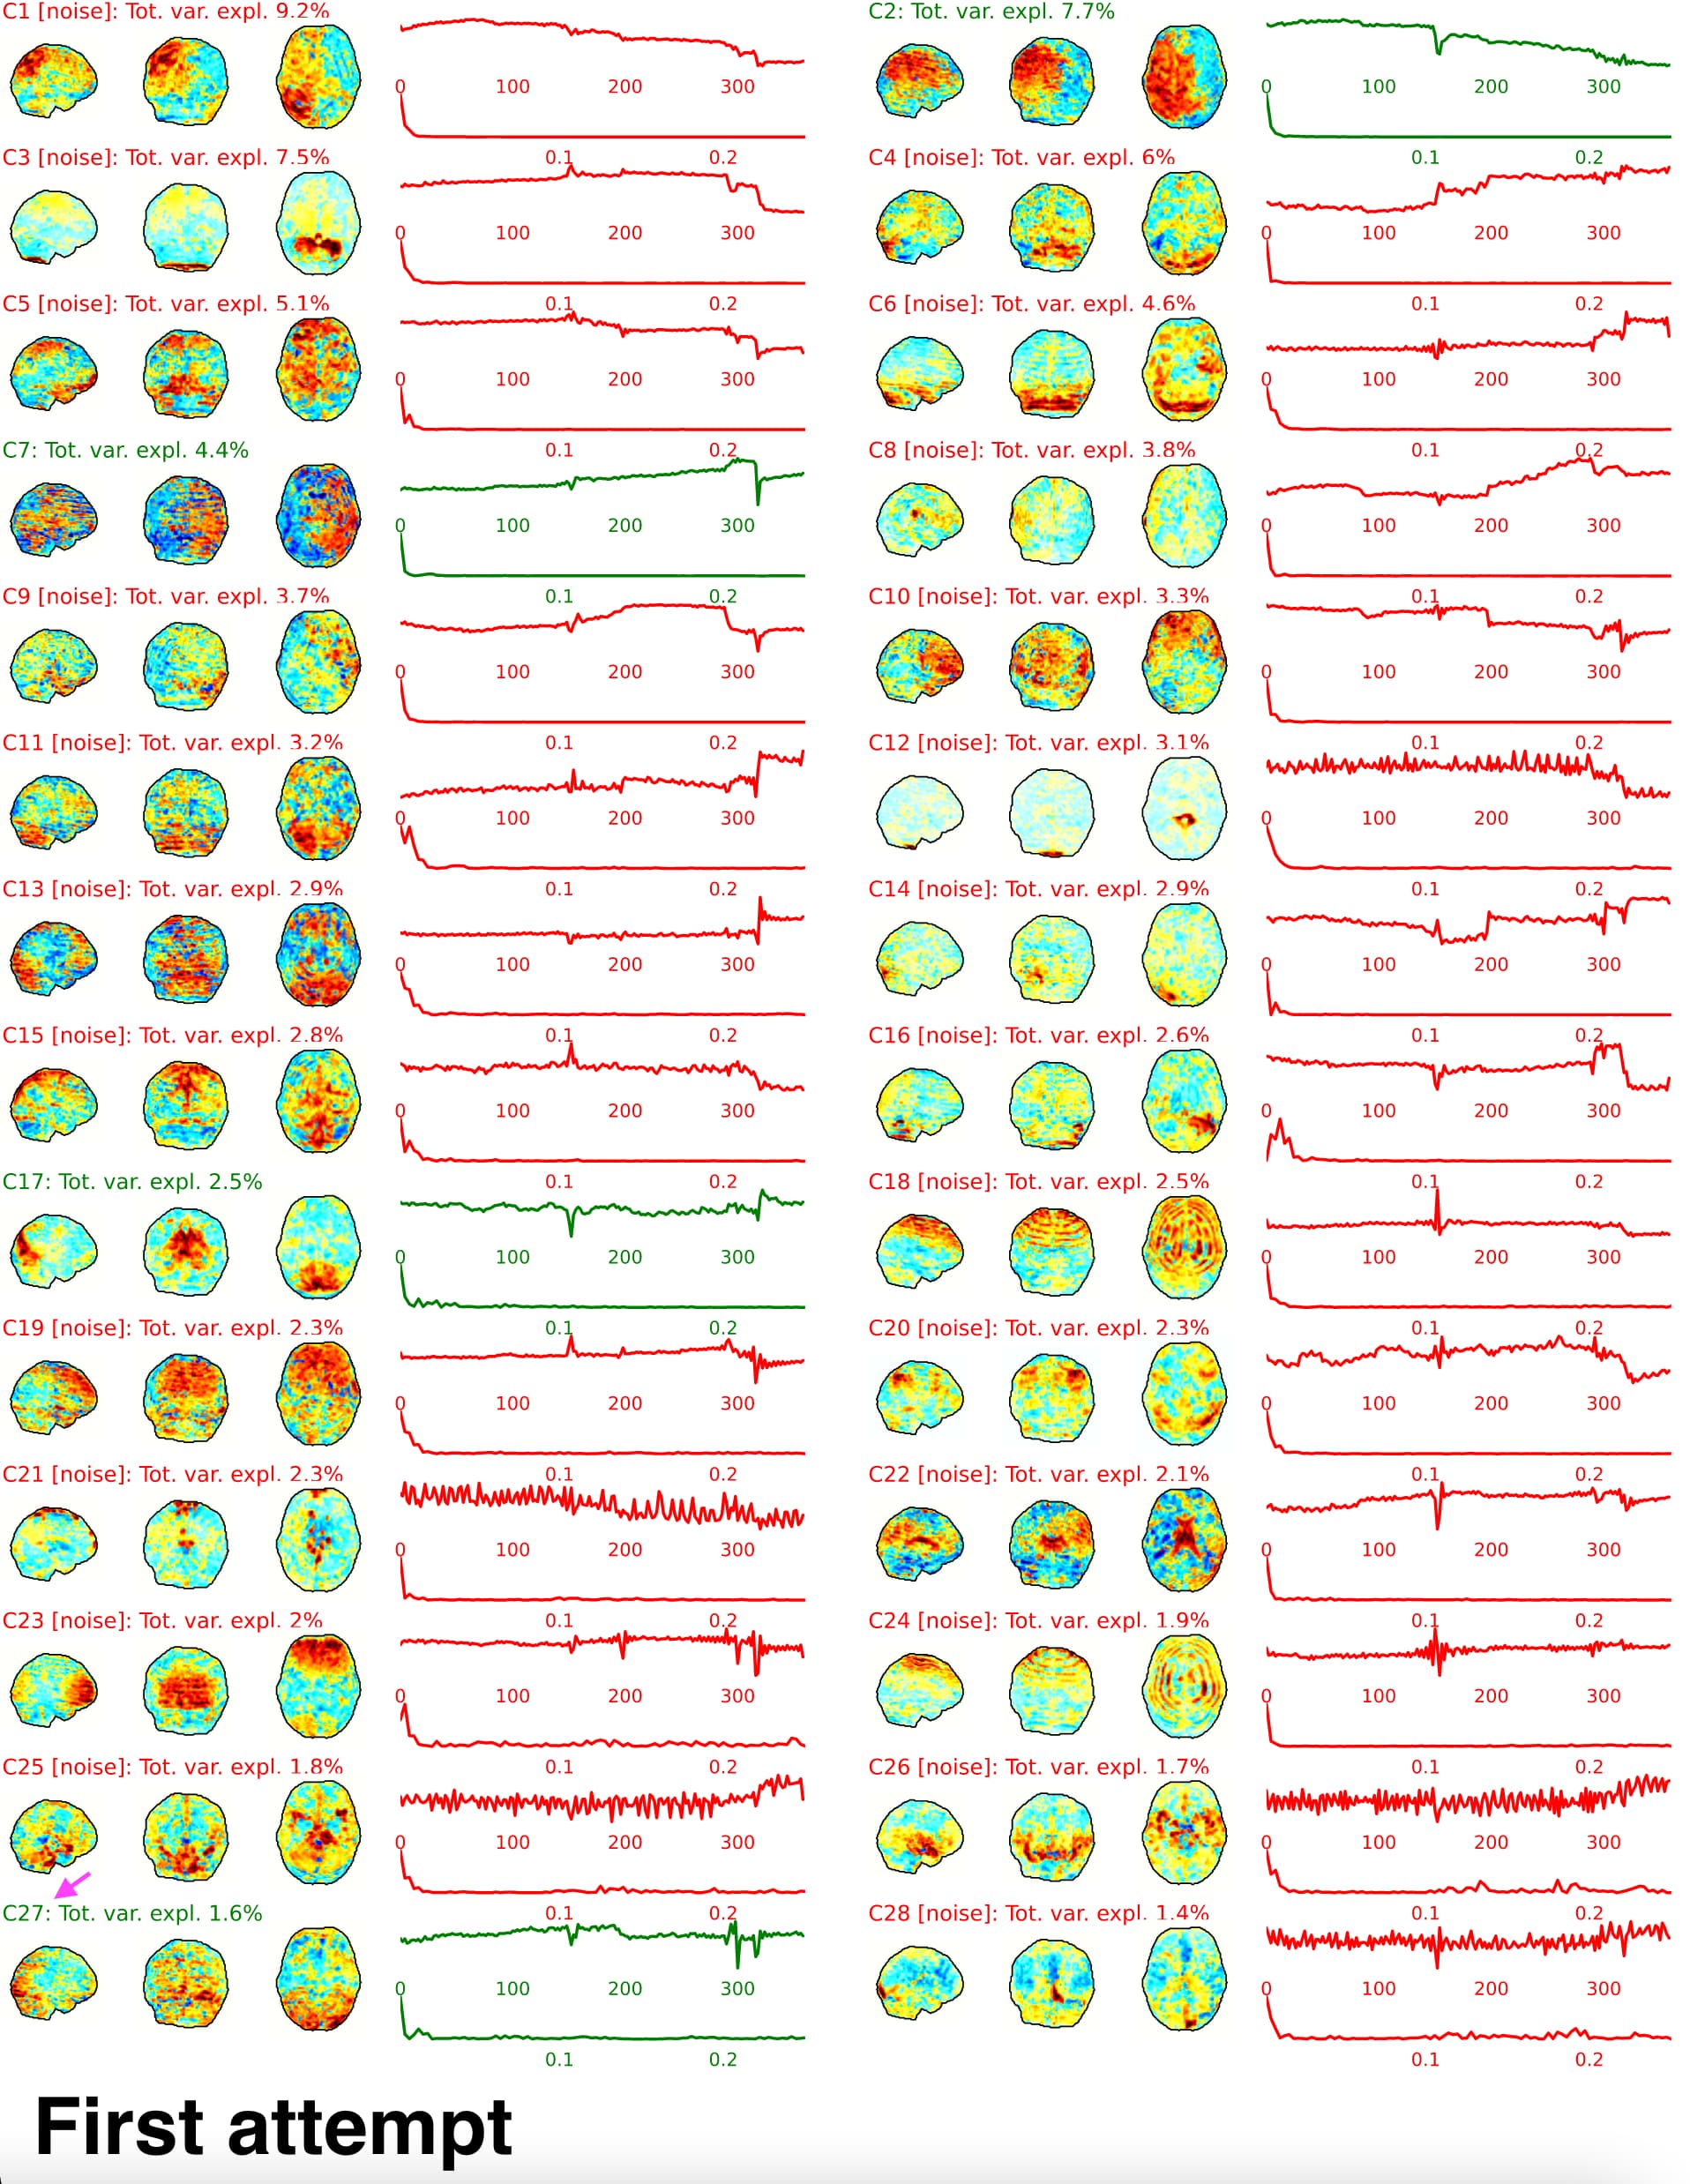
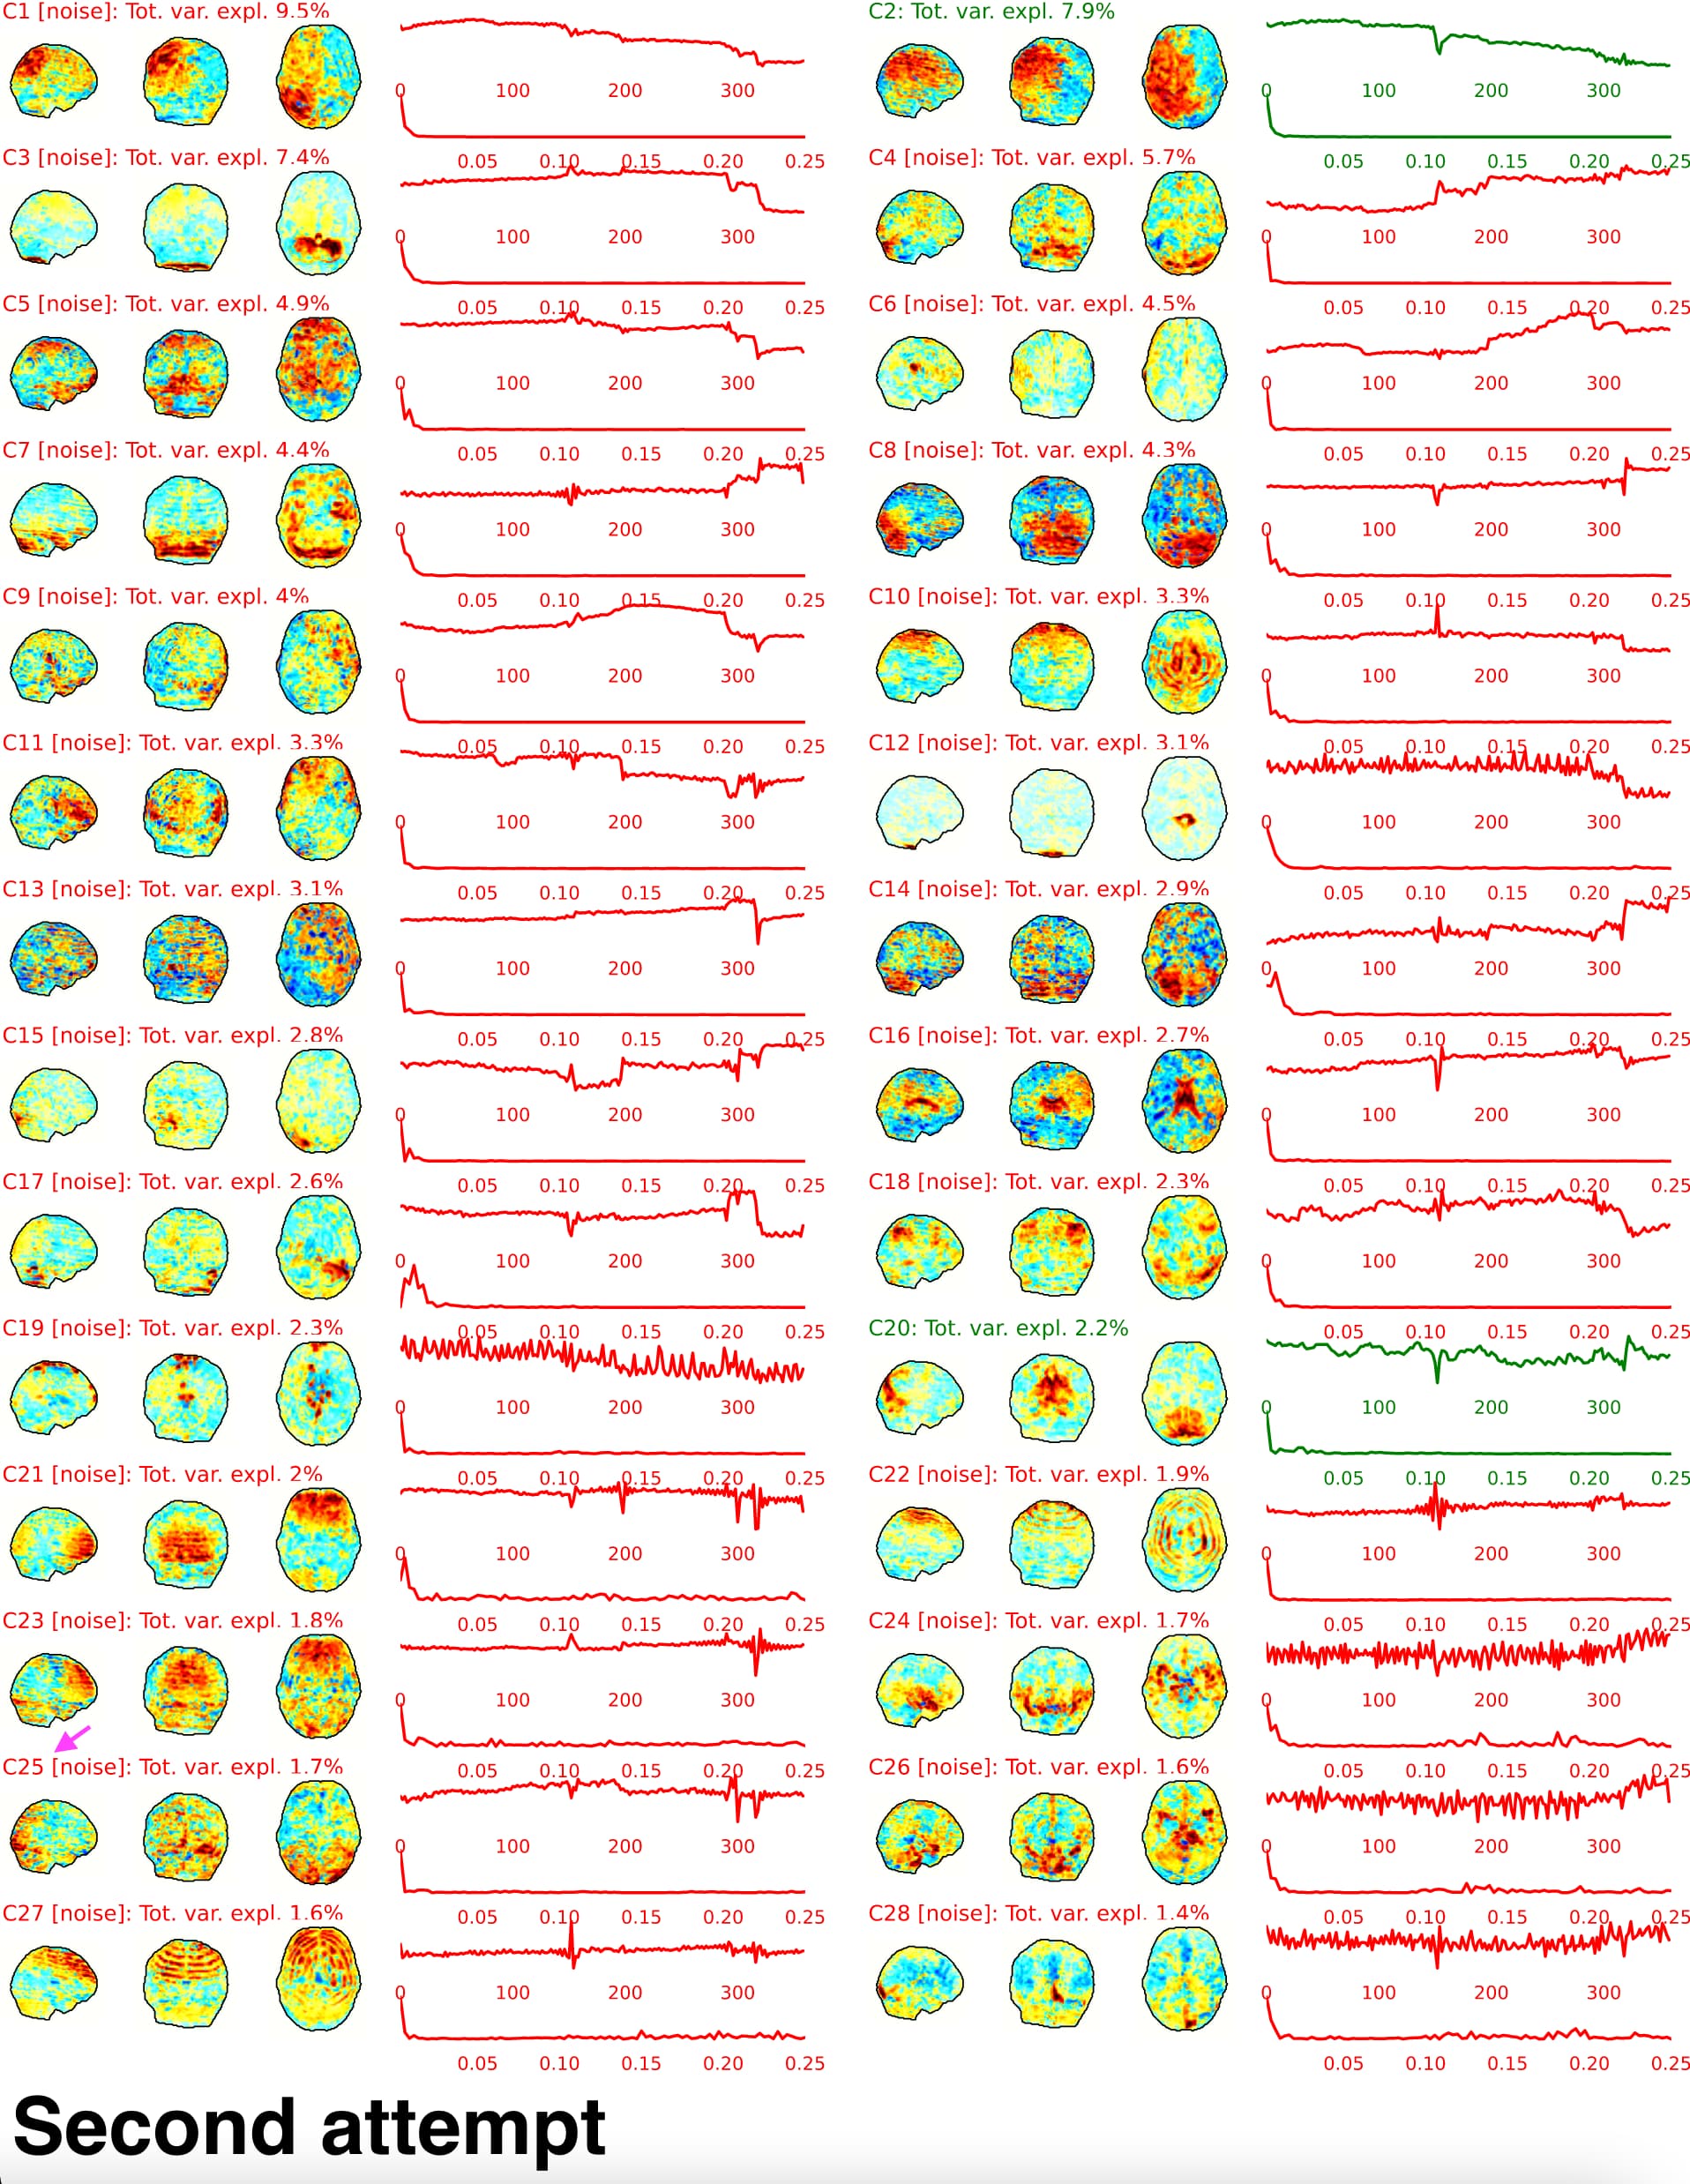
First, the random seed cannot control the random initialization of MELODIC and generate different outputs. From the report HTML file, we found the ICA components vary in order, spatial patterns, and temporal patterns (see figure 1 and figure 2). For example, C13 in the first attempt is similar to C8 in the second attempt. And the spatial patterns and temporal patterns in the first attempt C13 have a slight difference compared to C8 in the second attempt.
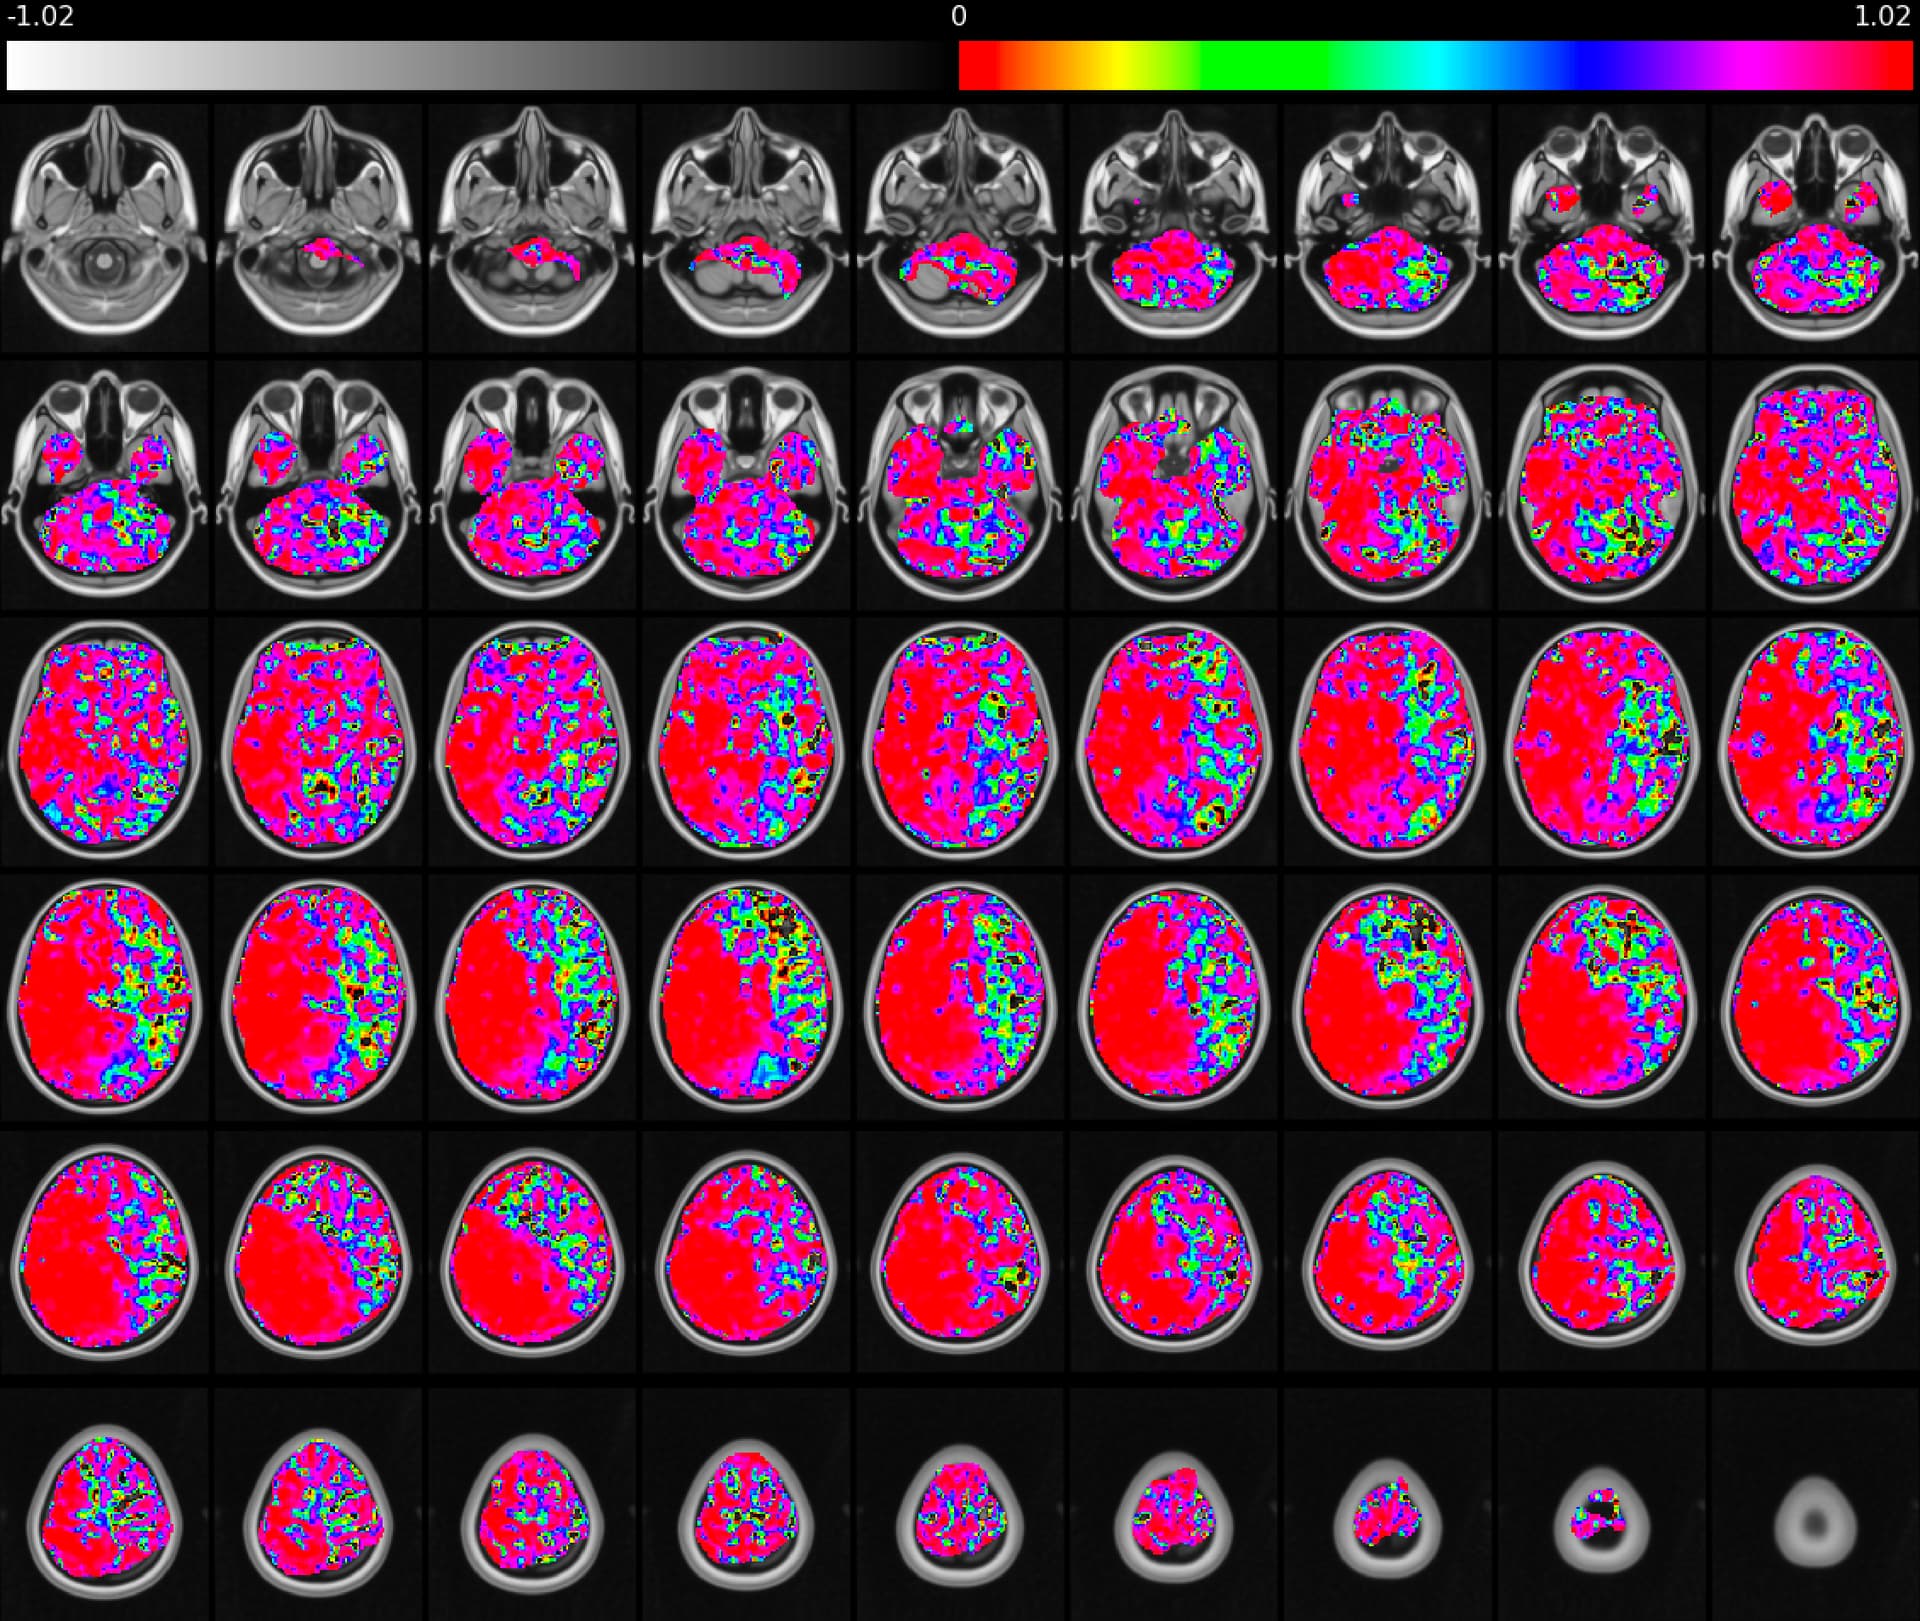
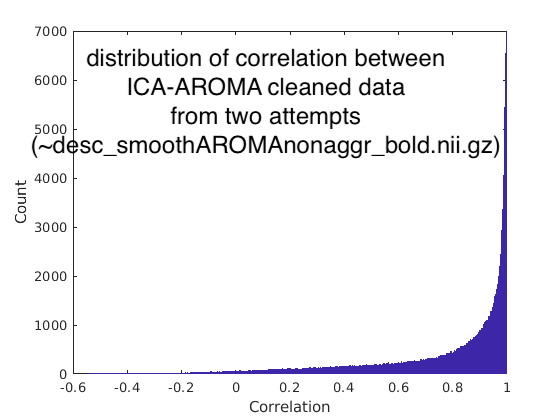
We speculated that the ICA-AROMA or MELODIC might generate great variation between attempts on the same data. We evaluate the ICA-AROMA cleaned images (~space-MNI152NLin6Asym_desc-smoothAROMAnonaggr_bold.nii.gz). In the same voxel from the two attempts, we did observe a slight difference between two time series. To quantify these differences, we calculate the time series correlation across two attempts for each voxel. The distribution of correlation is shown below (figure 3). We are surprised that the variation between the two attempts is quite considerable. There are 10% of voxels that have correlation < 0.3689 between two attempts (quantiles of correlations: Q1=0.6874, median=0.9007, Q3=0.9761).
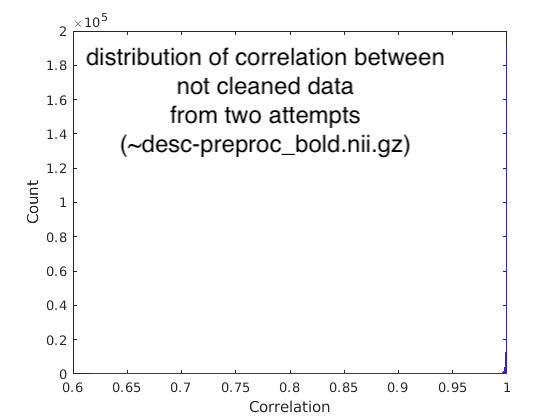
To make sure the variabilities stemmed from the ICA-AROMA or MELODIC. We also evaluated the fmriprep final output bold images (~space-MNI152NLin6Asym_res-2_desc-preproc_bold.nii.gz), which did not clean noise components from ICA-AROMA. Again we calculated the distribution of correlation and showed it below (figure 4). With random seeds were set, the correlation of two attempts without ICA-AROMA showed high consistency (quantiles of correlations: Q1=0.9996, median=0.9998, Q3=0.9999; percentile at 10% is 0.9990). Thus, it is clear that the variabilities come from the ICA-AROMA or MELODIC.
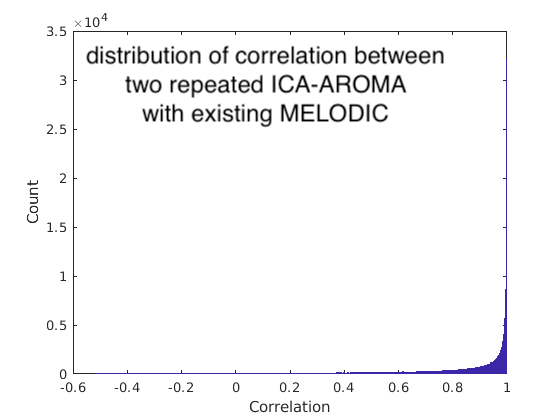
From the components shown in HTML reports, we speculated that the MELODIC might be the source of variabilities. But, we also wonder if ICA-AROMA along generated some variation between repetitive attempts. From the components figures, the C27 in the first attempt is similar to C25 in the second attempt. The C27 in the first attempt is classified as non-noise, but the C25 in the second attempt is classified as noise. The ICA-AROMA implemented bootstrapping with 1000 samples on 90% data that might produce the stochasticity of classification. To evaluate the possibility, we downloaded the latest ICA-AROMA (v0.4.4-beta) and ran the ICA-AROMA with existing MELODIC output from the second attempt (located in the intermediate work directory ~/func_preproc_task_rest_wf/ica_aroma_wf/melodic/). We tried about ten repetitions with existing MELODIC and got one inconsistent result. The one inconsistent result classified the C8 as noise. We also evaluate the distribution of time series correlation between repeated ICA-AROMA (with existing MELODIC) on the same data (figure 5). Because we repeated ten times to get one inconsistent classification, I would say the variation is acceptable (quantile: Q1=0.7889, median=0.9505, Q3=0.9927; percentile at 10%=0.4952). But it is highly dependent on how the data is. And we don’t know if the random seed could control this in fmriprep.
From the investigation of our own data, we found that the ICA-AROMA (and MELODIC) are not replicable on the same data. We knew that getting 100% reproducible outcomes across multiple attempts on the same data was impossible. But we think the variabilities are pretty considerable and would like to share them with the community. Specifically, we speculated that the MELODIC is the source to generate significant variation across attempts on the same data. The ICA-AROMA along (with existing MELODIC output) might also cause some variation through repeated trials. Because we only have limited empirical experience in the reproducibility of image preprocessing, we’re worried about the variabilities. We have some questions, and we’re eager to hear the comments from the community.
- Actually, we don’t know what is the gold standard to evaluate the consistency of preprocessing on the same data. Would you think the variabilities of ICA-AROMA and MELODIC on the two attempts we reported are acceptable?
- Is there any way to reduce the variabilities? For example, could we tweak MELODIC and ICA-AROMA to have more robust outcomes?
Many thanks,
Yu-Shiang